


 FxWirePro: NZD/USD edges lower, remains on back foot
  FxWirePro: AUD/USD dips after RBA Governor speech
  FxWirePro: EUR/AUD outlook weaker on renewed downside pressure
  Crypto Action Bias: ETHUSD Stands Out as the Bullish Pair to Watch
  FxWirePro: USD/CAD gaining momentum for a move towards 1.4200 level
  FxWirePro: AUD/USD falls after softer-than-expected Australian Q2 CPI
  FxWirePro: USD/CAD runs out of steam but maintains bullish outlook
  FxWirePro : USD/JPY holds relatively bid on 163 ahead Of FOMC,BoJ meetings
  AUDJPY Weakness Deepens: Sell Rallies Toward 112 as Aussie Dollar Falters
  FxWirePro- Major Pair levels and bias summary
  FxWirePro: GBP/AUD gains some upside momentum but still bearish
  FxWirePro: GBP/USD edges higher as traders await BoE guidance and UK fiscal clarity
  FxWirePro: EUR/NZD up trend gains momentum but hurdles ahead
  JPY Action Bias: USDJPY Emerges as the Clear Bullish Pair to Watch Amid Mixed Crosses
  FxWirePro: USD/ZAR retreats but trend is still bullish
  NZDJPY Pullback: Sell Rallies Toward 93.30 as Yen Weakness Eases


Candlestick pattern- Shooting star
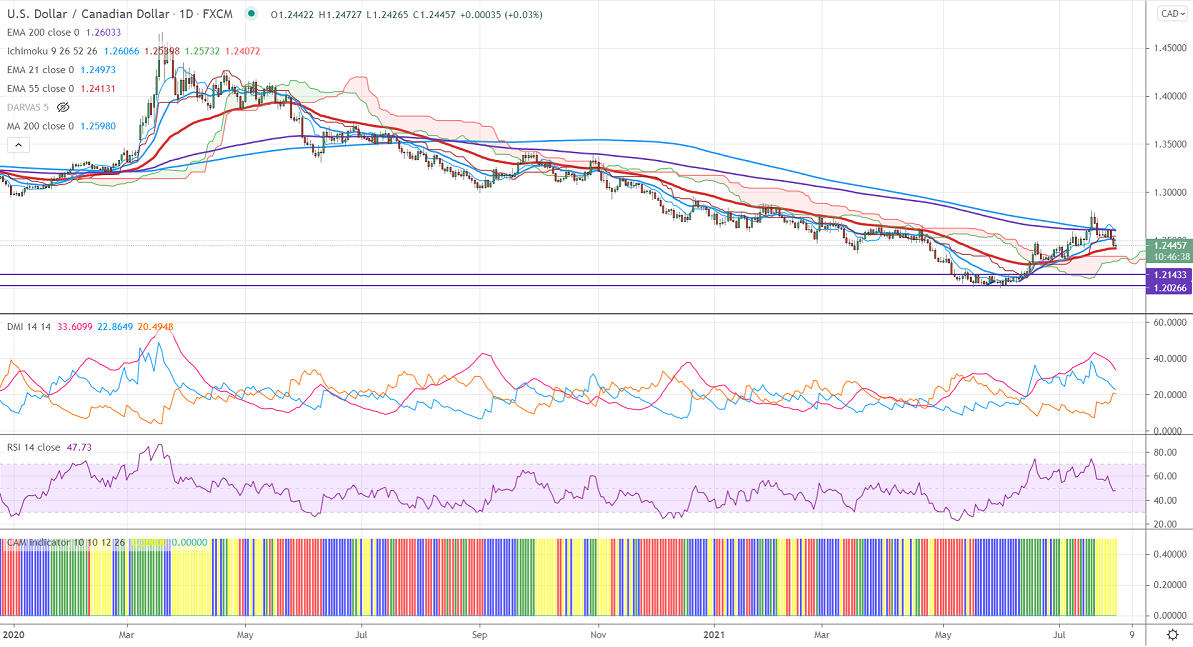
Ichimoku Analysis (Daily Chart)
Tenken-Sen- 1.26198
Kijun-Sen- 1.253978
USDCAD is trading lower for a second consecutive week and has lost more than 350 pips.ob board-based US dollar selling. The dovish fed comments and weak US economic data are putting pressure on the US dollar. US Gross domestic product surged at an annual rate of 6.3% in the second quarter slightly below the estimated 8.5%. The number of people who have filed for unemployment benefits by 24000 to 400000 last week compared to a forecast of 382000. The pair hits an intraday low of 1.24295 and is currently trading 1.24353. Markets eye US PCE and Canada GDP for further direction.
WTI crude holds well above $72 on the US inventory drop. According to EIA, inventories fell by 4.1 million barrels compared to a forecast of -2.6 million.
On the flip side, immediate support stands at 1.2400, and an indicative break below that level will drag the pair down till 1.2360/1.2300.
The pair is facing strong resistance at 1.2610 (200-day EMA), violation above will take till 1.2660/1.2700/1.27415.
Indicator (Daily chart)
CAM indicator-Neutral
Directional movement index –Neutral
It is good to sell on rallies around 1.2605-08 with SL around 1.2660 for the TP of 1.2465.


