


 FxWirePro- Woodies pivot (Major)
  FxWirePro: AUD/USD gains some ground but outlook is bearish
  Nikkei Surges Past 65,000 on Suspected Yen Weakness: Tech Giants Like Advantest and NEC Lead Explosive Gains
  FxWirePro: NZD/USD consolidates overnight gains, but loses momentum
  FxWirePro: GBP/NZD remains weak, eyes 38.2%fib support
  FxWirePro: USD/ZAR gains as stronger dollar outweighs upbeat South Africa's trade surplus
  Major European Indices Score Extremely Bullish: DAX Eyes 26000, CAC Targets 8600, FTSE100 at 11000 – Key Levels to Watch
  FxWirePro: GBP/USD rises as soft US data pressures dollar
  NZDJPY Bullish Rebound: Buy Dips as EMAs Align for 97 Target
  FxWirePro- Major Crypto levels and bias summary
  FxWirePro- Major Pair levels and bias summary
  FxWirePro- Major Crypto levels and bias summary
  AUDJPY Volatile After Massive Sell-Off: Sell Rallies at 113, Targeting 110 as Bearish Momentum Surges
  FxWirePro- Woodies pivot (Major)
  FxWirePro: GBP/AUD drifts lower after BOE rate decision
  FxWirePro- Major Pair levels and bias summary
  FxWirePro: GBP/NZD remains weak, eyes 38.2%fib support


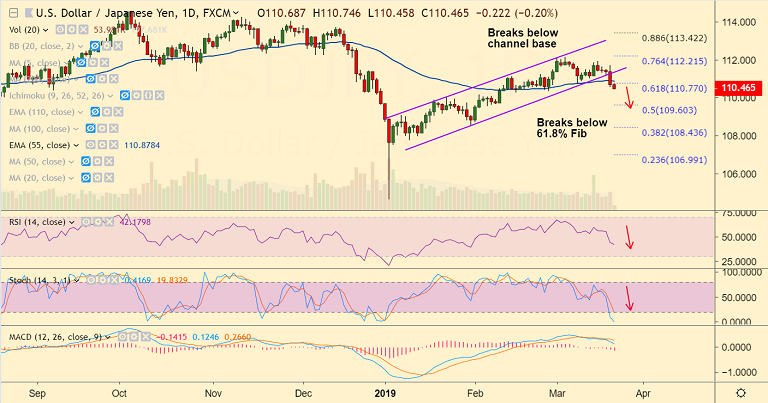
USD/JPY chart - Trading View
- USD/JPY is extending previous session's weakness, hits fresh monthly lows at 110.45.
- The pair is trading 0.19% lower on the day at 110.47 at 0400 GMT, bias bearish.
- The Fed kept interest rate unchanged as expected, signaled no rate hikes for the rest of the year and downgraded growth forecasts.
- The Fed announced the balance sheet reduction program will end in September. Many did not expect the Fed’s balance sheet run down to end in September.
- The US 10 year yield dropped sharply to 2.52% from 2.59%, having traded as high as 2.61% pre-Fed. Weakness in Treasury yields continue to weigh.
- Technical indicators on the daily charts have turned bearish. The pair has broken below rising channel and has slipped below 61.8% Fib.
- Immediate support lies at Lower Bollinger band at 110.42 and then 110.30 (trendline). Break below will see dip till 109.60.
- Focus on U.S. Jobless Claims data for further impetus.
Support levels - 110.42 (Lower BB), 110.30 (trendline), 109.60 (50% Fib)
Resistance levels - 110.77 (61.8% Fib), 110.87 (55-EMA), 111.07 (converged 5-DMA and 21-EMA)
For details on FxWirePro's Currency Strength Index, visit http://www.fxwirepro.com/currencyindex.


