


 FxWirePro:USD/JPY climbs back above 160.00 after BOJ rate decision
  FxWirePro: GBP/NZD remains weak, eyes 38.2%fib support
  FxWirePro: USD/CAD retreats after Canada posts stronger-than-expected GDP growth
  FxWirePro: GBP/AUD drifts lower after BOE rate decision
  FxWirePro: AUD/USD cedes early gains ,outlook bearish
  FxWirePro: GBP/USD rises as soft US data pressures dollar
  FxWirePro: USD/JPY dips as market assess risk of additional FX intervention.
  FxWirePro: USD/CNY downtrend loses steam, remains on bearish path
  FxWirePro- Woodies pivot (Major)
  All Major JPY Pairs Hit Extreme Bearish Score of -100: USDJPY, EURJPY, GBPJPY, AUDJPY, NZDJPY & CADJPY Flash Maximum Weakness
  AUDJPY Volatile After Massive Sell-Off: Sell Rallies at 113, Targeting 110 as Bearish Momentum Surges
  FxWirePro- Major Pair levels and bias summary
  FxWirePro- Major Pair levels and bias summary
  FxWirePro: USD/CNY dips to hit three year low,scope for further downside
  FxWirePro: EUR/ AUD dips below 1.6400 level, focus on near term support
  Major European Indices Score Extremely Bullish: DAX Eyes 26000, CAC Targets 8600, FTSE100 at 11000 – Key Levels to Watch
  FxWirePro- Major Crypto levels and bias summary


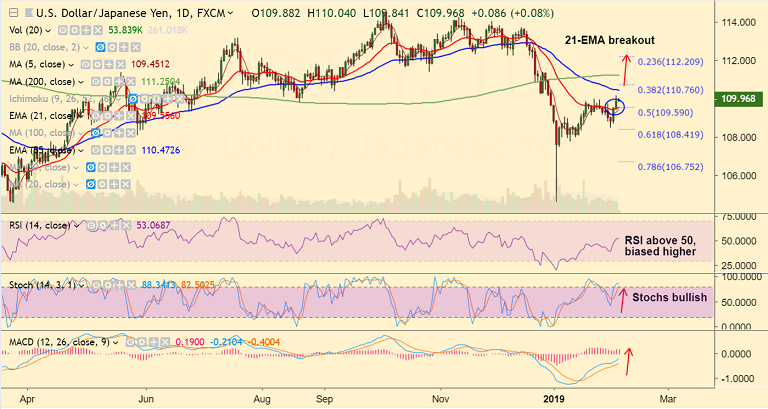
USD/JPY chart on Trading View used for analysis
- USD/JPY extends break above 21-EMA, intraday bias bullish.
- The pair is trading 0.08% higher on the day at 109.66 at 0300 GMT.
- Data released earlier today showed the Japanese January Markit Services PMI printed at 51.6, from 51 in the previous month.
- Technical indicators have turned bullish on the daily charts. Stochs and RSI have turned north. MACD also supports gains in the pair.
- Next major resistance on the upside lies at 55-EMA at 110.4722. Break above tragets 200-DMA at 111.25.
- Major trend is bearish. Retrace below 21-EMA will negate bullish bias.
Support levels - 109.55 (21-EMA), 109.45 (5-DMA), 108.43 (38.2% Fib)
Resistance levels - 110.47 (55-EMA), 110.77 (61.8% Fib), 111.25 (200-DMA)
Recommendation: Good to go long on dips, SL: 109.45, TP: 110.45/ 110.75/ 111
For details on FxWirePro's Currency Strength Index, visit http://www.fxwirepro.com/currencyindex.


