


 FxWirePro: NZD/USD jumps after US and Iran agree preliminary deal
  China’s Growth Faces Structural Challenges Amid Doubts Over Data
  FxWirePro: USD/CAD steadies around 1.3990 ,retains bid one
  Wall Street Analysts Weigh in on Latest NFP Data
  FxWirePro: GBP/USD slides toward critical support market reassesses UK political transition
  Fed May Resume Rate Hikes: BofA Analysts Outline Key Scenarios
  FxWirePro: GBP/AUD runs out of steam but maintains bullish outlook
  Goldman Predicts 50% Odds of 10% U.S. Tariff on Copper by Q1 Close
  FxWirePro: USD/JPY edges higher as the yen remains vulnerable despite repeated warnings of intervention.
  Energy Sector Outlook 2025: AI's Role and Market Dynamics
  Moldova Criticizes Russia Amid Transdniestria Energy Crisis
  US Futures Rise as Investors Eye Earnings, Inflation Data, and Wildfire Impacts
  Moody's Upgrades Argentina's Credit Rating Amid Economic Reforms
  Trump’s "Shock and Awe" Agenda: Executive Orders from Day One
  FxWirePro: GBP/NZD gaining momentum for a move towards 2.3350level


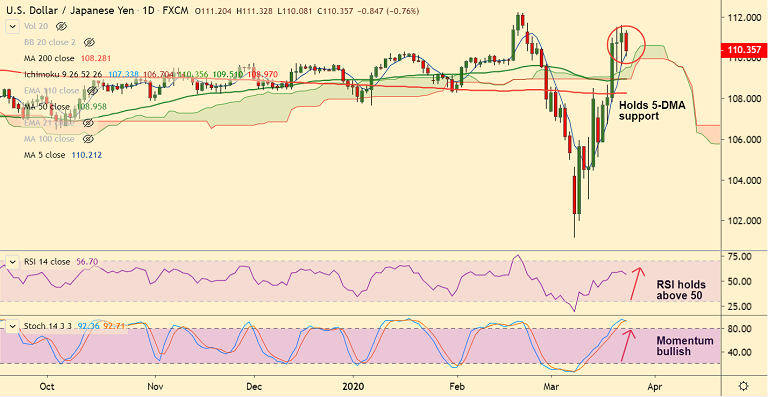
USD/JPY chart - Trading View
USD/JPY has paused 5 straight sessions of gains and was trading 0.41% lower on the day at 110.74 at around 09:10 GMT.
The pair hit session lows at 110.08 before paring some losses, holds support at 5-DMA.
Bank of Japan Governor Kuroda has said that the central bank is closely monitoring the market moves.
He added that the exchange-traded funds (ETF) paper loss is estimated to be about JPY 2-3 trillion now.
GMMA indicator shows - major trend is turning bullish, while minor trend is bullish.
Price action is above 200-DMA and daily cloud, momentum studies are bullish.
Volatility is rising and there is scope for further upside. Next hurdle for the bulls aligns at upper Bollinger band at 112.437.
Breach below 5-DMA (110.22) eyes next major support at 50-DMA (108.95). Retrace below 200-DMA negates upside bias.


