


 Major Pairs Action Bias: USDCAD and USDCHF Stand Out as Extremely Bullish While GBPUSD and NZDUSD Turn Extremely Bearish
  FxWirePro- Major Crypto levels and bias summary
  FxWirePro- Major Pair levels and bias summary
  FxWirePro: EUR/ AUD gains some ground , but remains on bearish path
  FxWirePro- Woodies pivot (Major)
  Crypto Action Bias: ETHUSD Stands Out as the Bullish Pair to Watch
  FxWirePro: NZD/USD edges lower, remains on back foot
  FxWirePro: USD/CAD runs out of steam but maintains bullish outlook
  FxWirePro: EUR/AUD outlook weaker on renewed downside pressure
  FxWirePro: USD/ZAR uptrend loses steam, remains on bullish path
  NZDJPY Pullback: Sell Rallies Toward 93.30 as Yen Weakness Eases
  FxWirePro: GBP/NZD gains some ground but bias is still bearish
  JPY Action Bias: USDJPY Emerges as the Clear Bullish Pair to Watch Amid Mixed Crosses
  FxWirePro: GBP/NZD maintains bersish bias with focus on 2.2900 level


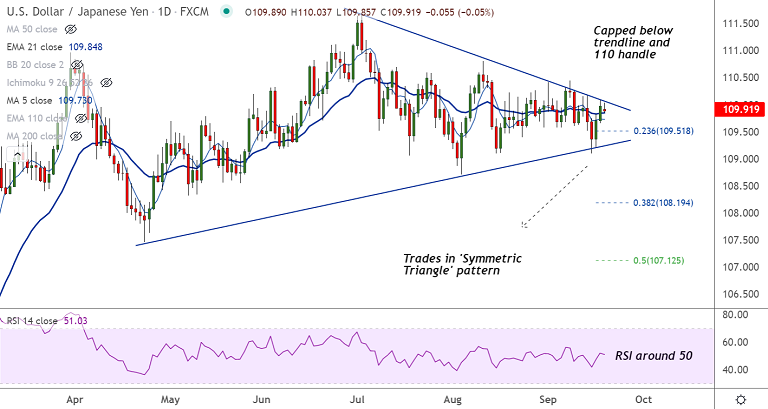
USD/JPY chart - Trading View
Technical Analysis: Bias Neutral
GMMA Indicator
- Shows neutral bias on daily charts
- Weekly charts show major bias is bullish
Ichimoku Analysis
- Price action is within the daily cloud and Chikou span is flat
- The pair holds comfortably above the Ichimoku cloud on the weekly charts
Oscillators
- Oscillators are in neutral territory
- RSI is flat around the 50 mark, while Stochs are biased higher
Bollinger Bands
- Volatility is low on the daily charts, Bollinger bands are narrow
Fundamental Overview:
The dollar scaled three-week peaks on Friday, but is struggling to hold gains in the early Asian session today.
Better-than-forecast U.S. retail sales data released on Thursday backed expectations for a reduction of asset purchases by the Federal Reserve before the end of the year.
Data on Friday showed University of Michigan consumer sentiment for September inched higher to 71 versus the final August reading of 70.3.
However, rise in the University of Michigan consumer sentiment was much less when compared to the improvements seen in the Empire States and Philadelphia Fed manufacturing surveys.
Investors now wait for the latest FOMC monetary policy decision on Wednesday for clues on the asset tapering and interest rate hike timelines.
The central bank is expected to open discussions on reducing its monthly bond purchases, while tying any actual change to U.S. job growth in September and beyond.
Summary: USD/JPY slipped lower from session highs at 110.03 and was trading 0.05% higher at 109.92 at around 04:45 GMT.
The pair continues trade in 'Symmetric Triangle' pattern and break out will provide a clear direction bias.


