


 FxWirePro- Major Crypto levels and bias summary
  FxWirePro: GBP/USD recovers some ground but bears are not done yet
  China's Refining Industry Faces Major Shakeup Amid Challenges
  US Gas Market Poised for Supercycle: Bernstein Analysts
  China’s Growth Faces Structural Challenges Amid Doubts Over Data
  UBS Projects Mixed Market Outlook for 2025 Amid Trump Policy Uncertainty
  Bitcoin Bleeds $704M in ETF Outflows as Institutional Exodus Accelerates
  European Stocks Rally on Chinese Growth and Mining Merger Speculation
  U.S. Treasury Yields Expected to Decline Amid Cooling Economic Pressures
  Stock Futures Dip as Investors Await Key Payrolls Data
  FxWirePro: GBP/AUD downside pressure builds, key support level in focus
  Urban studies: Doing research when every city is different
  Trump’s "Shock and Awe" Agenda: Executive Orders from Day One
  USD/CHF Smashes Higher to 0.7899 on Dollar Dominance—Bulls Bet on 0.7865 Dips for 0.8000 Breakout
  Moody's Upgrades Argentina's Credit Rating Amid Economic Reforms
  FxWirePro: EUR/ NZD dips below lower range, bearish bias increases
  NZD/JPY Breakout Blast: Kiwi Rocket Smashes 94.50 Resistance, Bulls Lock Sights on 95


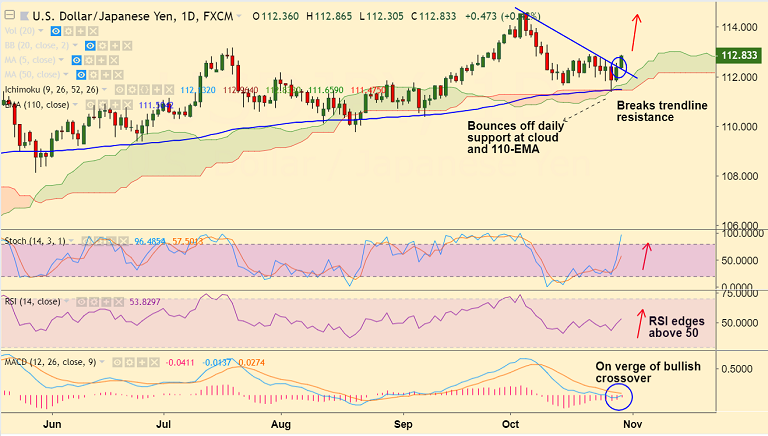
USD/JPY chart on Trading View used for analysis
- USD/JPY is extending positive momentum for the second straight sesson, bias higher.
- The pair is trading 0.42% higher on the day at 112.83 at the time of writing.
- Price action saw a solid rebound at the start of a new trading week, bounced of strong support at nearly converged daily cloud and 110-EMA.
- Stochs and RSI have turned higher and the major has broken strong trendline resistance at 112.35.
- Next immediate resistance lies at 113.17 (July 19 high) ahead of 114.55 (Oct 4 high).
- Failure to close above 20-DMA could see some flat trade. Retrace below 5-DMA to see further weakness.
Support levels - 112.48 (21-EMA), 112.15 (55-EMA), 111.50 (110-EMA)
Resistance levels - 113, 113.17 (July 19 high), 114.55 (Oct 4 high)
Recommendation: Good to go long on dips, SL: 112.30, TP: 113/ 113.15/ 114
For details on FxWirePro's Currency Strength Index, visit http://www.fxwirepro.com/currencyindex.


