


 FxWirePro- Major Pair levels and bias summary
  FxWirePro: GBP/NZD remains weak, eyes 38.2%fib support
  AUDJPY Volatile After Massive Sell-Off: Sell Rallies at 113, Targeting 110 as Bearish Momentum Surges
  FxWirePro: USD/ZAR gains as stronger dollar outweighs upbeat South Africa's trade surplus
  FxWirePro- Woodies pivot (Major)
  NZDJPY Bullish Rebound: Buy Dips as EMAs Align for 97 Target
  FxWirePro:USD/JPY climbs back above 160.00 after BOJ rate decision
  FxWirePro: GBP/NZD remains weak, eyes 38.2%fib support
  FxWirePro- Woodies pivot (Major)
  FxWirePro: GBP/USD rises as soft US data pressures dollar
  FxWirePro- Major Crypto levels and bias summary
  Nikkei Surges Past 65,000 on Suspected Yen Weakness: Tech Giants Like Advantest and NEC Lead Explosive Gains
  US Magnificent 7 Stocks Trend Score: Amazon & Microsoft Hit Extreme Bullish (+100) as Meta Drops to -100 — Key Resistance & Support Watchlist
  FxWirePro: GBP/AUD drifts lower after BOE rate decision
  FxWirePro: USD/CAD retreats after Canada posts stronger-than-expected GDP growth
  Major FX Action Bias & US Market Sentiment: NZD/USD (Extremely Bullish) & AUD/USD (Bullish) Watchlist


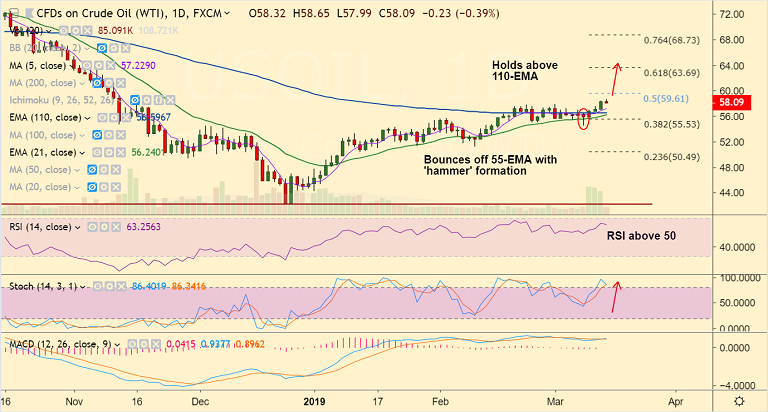
U.S. oil chart - Trading View
- U.S. oil is trading in a narrow range with session highs at 58.65 and lows at 57.98.
- Price is holding break above 110-EMA, technical bias still bullish.
- Bulls cheered a bigger-than-expected drop in the US EIA weekly crude stockpiles.
- Also, upbeat remarks from the Iraqi Oil Minister Al-Luaibi could also underpin prices.
- Increased expectations of tightening oil markets added to the bullish tone. U.S. crude oil production dipped by 100,000 bpd to 12 million bpd.
- Price action has bounced off 55-EMA with a 'hammer' formation. We see weakness only below 55-EMA.
- Next major resistance above 110-EMA lies at 50% Fib at 59.60. Retrace below 110-EMA will see test of 55-EMA. Break below 55-EMA can see dip till daily cloud.
Support levels - 56.53 (110-EMA), 55.53 (38.2% Fib), 54.85 (55-EMA)
Resistance levels - 57.85 (Mar 1 high), 59.61 (50% Fib), 61.97 (200-DMA)
Call update: Our previous call (https://www.econotimes.com/FxWirePro-US-oil-bounces-of-55-EMA-with-Hammer-formation-stay-long-on-close-above-110-EMA-1508943) has hit TP1.
Recommendation: Book partial profits at highs. Hold for further upside.
For details on FxWirePro's Currency Strength Index, visit http://www.fxwirepro.com/currencyindex.


