


 Nikkei Surges Past 65,000 on Suspected Yen Weakness: Tech Giants Like Advantest and NEC Lead Explosive Gains
  NZDJPY Retreats on Yen Strength – Bearish Setup Targets 90 After Hitting 92.75 Low
  Major FX Action Bias & US Market Sentiment: NZD/USD (Extremely Bullish) & AUD/USD (Bullish) Watchlist
  AUD/JPY Slips Below 112 as BOJ Intervention Sparks Bearish Momentum: Sell the Rallies
  FxWirePro: USD/CAD retreats after Canada posts stronger-than-expected GDP growth
  FxWirePro: USD/ZAR gains as stronger dollar outweighs upbeat South Africa's trade surplus
  FxWirePro- Major Crypto levels and bias summary
  FxWirePro: USD/CNY dips to hit three year low,scope for further downside
  NZDJPY Bullish Rebound: Buy Dips as EMAs Align for 97 Target
  FxWirePro: GBP/NZD remains weak, eyes 38.2%fib support
  Major European Indices Score Extremely Bullish: DAX Eyes 26000, CAC Targets 8600, FTSE100 at 11000 – Key Levels to Watch
  FxWirePro- Major Pair levels and bias summary
  FxWirePro: AUD/USD gains some ground but outlook is bearish
  JPY Currency Meter Signals: NZDJPY Bullish (+25) vs CHFJPY (-100) – These Pairs Could Move Next
  FxWirePro: EUR/ AUD dips below 1.6400 level, focus on near term support
  US Magnificent 7 Stocks Trend Score: Amazon & Microsoft Hit Extreme Bullish (+100) as Meta Drops to -100 — Key Resistance & Support Watchlist


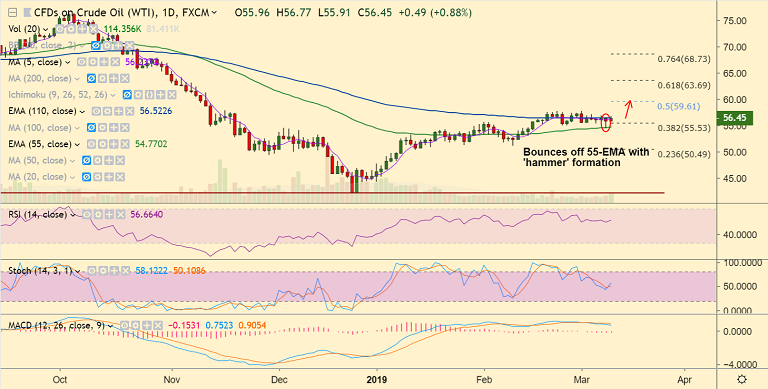
U.S. oil chart - Trading View
- U.S. oil is extending sideways grind along 110-EMA.
- The pair trades in an extremely narrow range with session highs at 56.77 and lows at 55.91.
- Price action has bounced off 55-EMA with a 'hammer' formation. We see weakness only below 55-EMA.
- Technical indicators do not show a clear firectional bias. Decisive break above 110-EMA could see further gains.
- Next major resistance above 110-EMA lies at 50% Fib at 59.60. Break below 55-EMA can see dip till daily clous.
Support levels - 55.53 (38.2% Fib), 54.77 (55-EMA), 51.22 (Feb 11 low)
Resistance levels - 57.85 (Mar 1 high), 59.61 (50% Fib), 62.01 (200-DMA)
Recommendation: Good to go long on decisive close above 110-EMA, target 57.80/ 59.60
For details on FxWirePro's Currency Strength Index, visit http://www.fxwirepro.com/currencyindex.


