


 FxWirePro: AUD/USD drifts lower, uninspired by jobs beat
  FxWirePro- Major Pair levels and bias summary
  FxWirePro- Major Crypto levels and bias summary
  FxWirePro: AUD/USD eases after Australian mixed CPI data
  EURJPY Bounce Loses Steam Below 184 — Sell-the-Rally Setup Eyes 183 Target
  AUDJPY Bears Take a Breather at 111.50, But ‘Sell on Rallies’ Still Eyes 110
  Geopolitical Shocks That Could Reshape Financial Markets in 2025
  Moldova Criticizes Russia Amid Transdniestria Energy Crisis
  S&P 500 Relies on Tech for Growth in Q4 2024, Says Barclays
  Gold Prices Fall Amid Rate Jitters; Copper Steady as China Stimulus Eyed
  FxWirePro- Major Pair levels and bias summary
  Wall Street Analysts Weigh in on Latest NFP Data
  BTC Slips Below $60K as Institutional Demand Dries Up — Bears Eye $59K Support, Rallies to $63K for Shorts
  Sterling Slump Sends GBPJPY Toward 212.60 — Bearish EMA Stack Eyes 210
  Moody's Upgrades Argentina's Credit Rating Amid Economic Reforms
  NZDJPY: The Kiwi Yen's Bull Run Hits a Brick Wall at 92 — Sell the Rally?


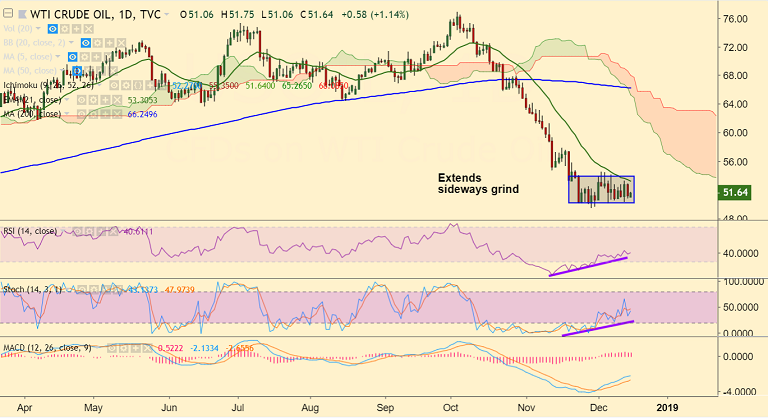
US Oil chart on Trading View used for analysis
- US Oil extends sideways grind, remains capped below 21-EMA.
- Recovery attempts lack traction, upside capped at 5-DMA.
- Sentiment continues to be dented by the looming supply glut worries and economic growth concerns.
- Markets skeptical whether the planned supply cuts by the OPEC and other producers such as Russia will be able to stabilize the oil markets.
- Technical studies are biased lower. Price action below cloud and major moving averages.
- Markets look forward to the US weekly crude stocks data for fresh direction.
- Immediate support lies at 49.72 (Lower BB), while immediate resistance lies at 21-EMA at 53.30.
For details on FxWirePro's Currency Strength Index, visit http://www.fxwirepro.com/currencyindex.


