


 Stock Futures Dip as Investors Await Key Payrolls Data
  US Gas Market Poised for Supercycle: Bernstein Analysts
  Global Markets React to Strong U.S. Jobs Data and Rising Yields
  2025 Market Outlook: Key January Events to Watch
  Oil Prices Dip Slightly Amid Focus on Russian Sanctions and U.S. Inflation Data
  Lithium Market Poised for Recovery Amid Supply Cuts and Rising Demand
  China’s Growth Faces Structural Challenges Amid Doubts Over Data
  Goldman Predicts 50% Odds of 10% U.S. Tariff on Copper by Q1 Close
  Trump’s "Shock and Awe" Agenda: Executive Orders from Day One
  Moody's Upgrades Argentina's Credit Rating Amid Economic Reforms
  UBS Projects Mixed Market Outlook for 2025 Amid Trump Policy Uncertainty
  Indonesia Surprises Markets with Interest Rate Cut Amid Currency Pressure
  Gold Prices Slide as Rate Cut Prospects Diminish; Copper Gains on China Stimulus Hopes
  Moldova Criticizes Russia Amid Transdniestria Energy Crisis
  U.S. Stocks vs. Bonds: Are Diverging Valuations Signaling a Shift?
  UBS Predicts Potential Fed Rate Cut Amid Strong US Economic Data
  Geopolitical Shocks That Could Reshape Financial Markets in 2025


In this write-up, we wish to run you through Turnover ratios of various asset classes. As you can observe the 3rd exhibit, the volumes are monthly and the turnover ratio is annualized (monthly trading volume annualized divided by the amount outstanding).
UST Cash are primary dealer transactions in all US government securities. The US Treasuries market has become more cautious in recent days as the drumbeat of fiscal stimulus got a tad louder in the Eurozone. Coupled with speculation of ultra-long tenor (50Y, 100Y) issuances from the US Treasury and Fed minutes indicating that this is just a mid-cycle adjustment (not the start of a major Fed easing cycle), some uncertainty premium has worked its way into the curve.
UST futures are from Bloomberg. JGBs are OTC volumes in all Japanese government securities. Bunds, Gold, Oil, and Copper are futures.
Gold includes Gold ETFs. Min-Max chart is based on the turnover ratio. For Bunds and Commodities, futures trading volumes are used while the outstanding amount is proxied by open interest.
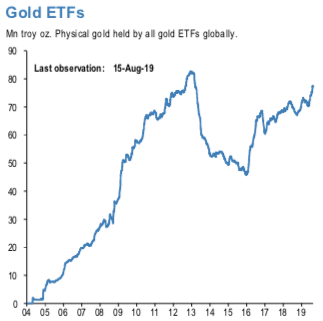
Gold’s gaining its traction a safe-haven sentiment, with inflows into ETFs (exchange-traded funds) hitting 1,000 tons since holdings bottomed in early 2016 after a prolonged unwind in the wake of the global financial crisis (refer 1st chart). While CFTC’s speculative positions in gold have also risen considerably (refer 2nd chart), please be noted that the rising curve indicates the net longs in CFTC gold’s futures.
Well, yesterday, the total ETF holdings surged to 2,424.9 tons, the highest since 2013. Price of the precious yellow metal has constantly been gaining this year (gained about 15.72% since this May) as apprehensive investors are worried for the prevailing global slowdown and need safeguarding from the same, the relentless trade turmoil, geopolitical issues like Brexit, NAFTA etc and struggle in the bond market are indicating the U.S. is most likely headed for another recessionary phase.
The diamond reflects the latest turnover observation. The thin blue line marks the distance between the min and max for the complete time series since Jan-2005 onwards. Y/Y change is change in YTD notional volumes over the same period last year.
Leveraged funds like hedge funds recently increased bearish wagers on futures linked to the VIX to the highest level since September, Commodity Futures Trading Commission data as of Aug. 13. There are almost five bearish contracts outstanding for every bullish one held by leveraged funds, the data show. Courtesy: JPM


