


 U.S. Banks Report Strong Q4 Profits Amid Investment Banking Surge
  US Gas Market Poised for Supercycle: Bernstein Analysts
  All Major JPY Pairs Hit Extreme Bearish Score of -100: USDJPY, EURJPY, GBPJPY, AUDJPY, NZDJPY & CADJPY Flash Maximum Weakness
  FxWirePro- Major Pair levels and bias summary
  FxWirePro:USD/JPY climbs back above 160.00 after BOJ rate decision
  UBS Projects Mixed Market Outlook for 2025 Amid Trump Policy Uncertainty
  China’s Growth Faces Structural Challenges Amid Doubts Over Data
  FxWirePro: AUD/USD gains some ground but outlook is bearish
  FxWirePro: GBP/NZD remains weak, eyes 38.2%fib support
  Urban studies: Doing research when every city is different
  US Magnificent 7 Stocks Trend Score: Amazon & Microsoft Hit Extreme Bullish (+100) as Meta Drops to -100 — Key Resistance & Support Watchlist
  Global Markets React to Strong U.S. Jobs Data and Rising Yields
  US Magnificent 7 Stocks Trend Score: Amazon & Microsoft Hit Extreme Bullish (+100) as Meta Drops to -100 — Key Resistance & Support Watchlist
  FxWirePro: GBP/NZD remains weak, eyes 38.2%fib support
  Wall Street Analysts Weigh in on Latest NFP Data
  FxWirePro: USD/JPY dips as market assess risk of additional FX intervention.
  European Stocks Rally on Chinese Growth and Mining Merger Speculation


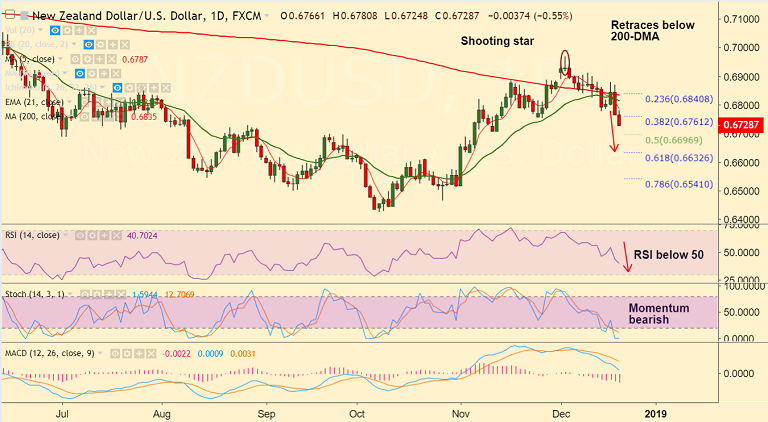
NZD/USD chart on Trading View used for analysis
- NZD/USD retraces break above 200-DMA slumps lower overnight on hawkish Fed hike.
- The pair is extending weakness today after New Zealand Q3 GDP missed forecasts, hits 5-week lows at 0.6724.
- Data released earlier today showed New Zealand Q3 GDP arrived at +0.3% q/q vs the 0.6% expected and 1.0% in Q2.
- For the y/y, GDP was up 2.6% missing forecasts at 2.8% compared to 3.2% prior, revised up from 2.8%.
- Antipodean currencies further under pressure amid risk-off market profile.
- Technical indicators have shown a sharp switch in trajectory. RSI and Stochs are sharply lower.
- The pair has broken below 38.2% Fib and is now on track to test next major support at 0.67.
Support levels - 0.67, 0.6632 (61.8% Fib), 0.6598 (Sept 28 low)
Resistance levels - 0.6761 (38.2% Fib), 0.6787 (5-DMA), 0.6815 (21-EMA)
Recommendation: Good to go short on upticks, SL: 0.6790, TP: 0.67/ 0.6635
For details on FxWirePro's Currency Strength Index, visit http://www.fxwirepro.com/currencyindex.


