


 FxWirePro:USD/JPY climbs back above 160.00 after BOJ rate decision
  JPY Currency Meter Signals: NZDJPY Bullish (+25) vs CHFJPY (-100) – These Pairs Could Move Next
  FxWirePro: GBP/AUD drifts lower after BOE rate decision
  FxWirePro: GBP/NZD remains weak, eyes 38.2%fib support
  FxWirePro: USD/CAD retreats after Canada posts stronger-than-expected GDP growth
  US Magnificent 7 Stocks Trend Score: Amazon & Microsoft Hit Extreme Bullish (+100) as Meta Drops to -100 — Key Resistance & Support Watchlist
  US Magnificent 7 Stocks Trend Score: Amazon & Microsoft Hit Extreme Bullish (+100) as Meta Drops to -100 — Key Resistance & Support Watchlist
  NZDJPY Bullish Rebound: Buy Dips as EMAs Align for 97 Target
  FxWirePro: USD/CNY dips to hit three year low,scope for further downside
  FxWirePro: USD/ZAR gains as stronger dollar outweighs upbeat South Africa's trade surplus
  FxWirePro- Major Pair levels and bias summary
  NZDJPY Retreats on Yen Strength – Bearish Setup Targets 90 After Hitting 92.75 Low
  Major FX Action Bias & US Market Sentiment: NZD/USD (Extremely Bullish) & AUD/USD (Bullish) Watchlist
  Major European Indices Score Extremely Bullish: DAX Eyes 26000, CAC Targets 8600, FTSE100 at 11000 – Key Levels to Watch
  FxWirePro: NZD/USD consolidates overnight gains, but loses momentum
  FxWirePro- Major Crypto levels and bias summary


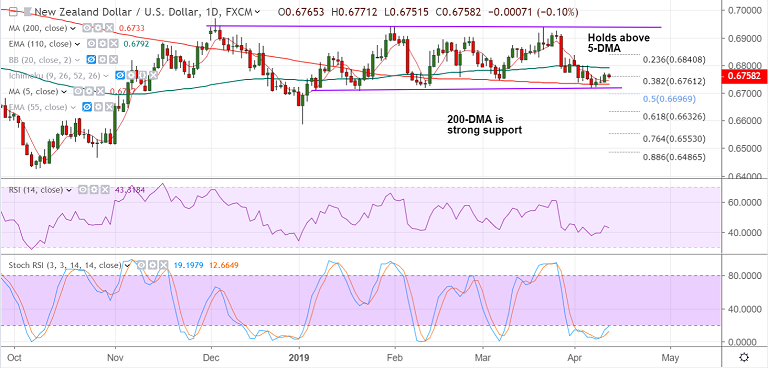
NZD/USD chart - Trading View
- NZD/USD trades marginally weaker on the day at 0.6758 at 1055 GMT.
- The pair has bounced off 200-DMA and channel base support, weakness only on break below.
- Price is holding above 5-DMA and is hovering around 38.2% Fib at 0.6761.
- RSI has turned and Stochs are at oversold levels with scope for minor pullbacks.
- Upside finds strong resistance at 1H 200-SMA at 0.6763. Break above will likely see gains upto 110-EMA at 0.6792.
- Breakout at 110-EMA confirms near-term bullishness. On the flipside, weakness to resume on decisive break below 200-DMA.
- Focus now on U.S. PPI and initial jobless claims for further impetus.
- The US PPI is expected to remain unchanged at 1.9% y/y but could increase to +0.3% from +0.1% on the monthly basis in March.
- Also, initial jobless claims for the week ended on April 05 could increase to 211K from 202K.
Support levels - 0.6746 (5-DMA), 0.6733 (200-DMA), 0.67
Resistance levels - 0.6763 (1H 200-SMA), 0.6792 (110-EMA), 0.68
For details on FxWirePro's Currency Strength Index, visit http://www.fxwirepro.com/currencyindex.


