


 JPY Currency Meter Signals: NZDJPY Bullish (+25) vs CHFJPY (-100) – These Pairs Could Move Next
  FxWirePro: GBP/AUD bears maintain upper hand
  FxWirePro- Major Pair levels and bias summary
  FxWirePro: EUR/ AUD dips below 1.6400 level, focus on near term support
  FxWirePro: USD/CNY dips to hit three year low,scope for further downside
  FxWirePro: USD/CAD retreats after Canada posts stronger-than-expected GDP growth
  AUDJPY Volatile After Massive Sell-Off: Sell Rallies at 113, Targeting 110 as Bearish Momentum Surges
  FxWirePro- Woodies pivot (Major)
  NZDJPY Retreats on Yen Strength – Bearish Setup Targets 90 After Hitting 92.75 Low
  FxWirePro- Major Crypto levels and bias summary
  FxWirePro:USD/JPY climbs back above 160.00 after BOJ rate decision
  FxWirePro- Woodies pivot (Major)
  Major European Indices Score Extremely Bullish: DAX Eyes 26000, CAC Targets 8600, FTSE100 at 11000 – Key Levels to Watch
  US Magnificent 7 Stocks Trend Score: Amazon & Microsoft Hit Extreme Bullish (+100) as Meta Drops to -100 — Key Resistance & Support Watchlist
  FxWirePro: GBP/AUD drifts lower after BOE rate decision
  FxWirePro- Major Pair levels and bias summary


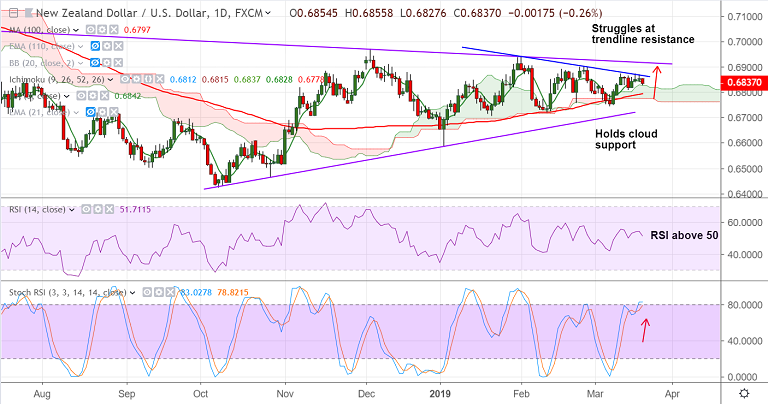
NZD/USD chart - Trading View
- NZD/USD fails at strong trendline resistance at 0.6870, edges lower to break below 5-DMA.
- The pair is trading at 0.6836 at 0710 GMT, down 0.26% at the time of writing.
- Technical studies for the pair are holding a slightly bullish bias. Break above 0.6870 could see gains upto 0.6915.
- Focus now on New Zealand Q4 GDP data along with FOMC meeting for further impetus.
- Markets are looking for a dovish FOMC outcome. NZ GDP is expected to show the growth rate ticked higher to 0.6 percent q/q in Q4 from 0.3 percent in Q3.
- Technical studies for the pair are holding a slightly bullish bias. Break above 0.6870 could see gains upto 0.6915.
- Price action is consolidating above daily cloud and break below will see dip till 200-DMA.
Support levels - 0.6828 (cloud top), 0.6797 (100-DMA), 0.6730 (trendline)
Resistance levels - 0.6842 (5-DMA), 0.6872 (Mar 12 high), 0.6915 (trendline)
For details on FxWirePro's Currency Strength Index, visit http://www.fxwirepro.com/currencyindex.


