


 FxWirePro: USD/ZAR remains buoyant, looks to extend gains
  Lithium Market Poised for Recovery Amid Supply Cuts and Rising Demand
  BTC Slips Below $60K as Institutional Demand Dries Up — Bears Eye $59K Support, Rallies to $63K for Shorts
  FxWirePro: USD/CAD hits 14-month high , Scope for further upside
  Fed May Resume Rate Hikes: BofA Analysts Outline Key Scenarios
  Moody's Upgrades Argentina's Credit Rating Amid Economic Reforms
  Oil Prices Dip Slightly Amid Focus on Russian Sanctions and U.S. Inflation Data
  FxWirePro: USD/JPY edges higher as the yen remains vulnerable despite repeated warnings of intervention.
  FxWirePro- Major Pair levels and bias summary
  FxWirePro- Major Crypto levels and bias summary
  Sterling Slump Sends GBPJPY Toward 212.60 — Bearish EMA Stack Eyes 210
  FxWirePro: AUD/USD drifts lower, uninspired by jobs beat
  U.S. Treasury Yields Expected to Decline Amid Cooling Economic Pressures
  FxWirePro- Woodies pivot (Major)
  S&P 500 Relies on Tech for Growth in Q4 2024, Says Barclays
  U.S. Banks Report Strong Q4 Profits Amid Investment Banking Surge
  Bitcoin Sheds $491M in ETF Outflows and Retreats Below $64K; Sellers Reload for $50K


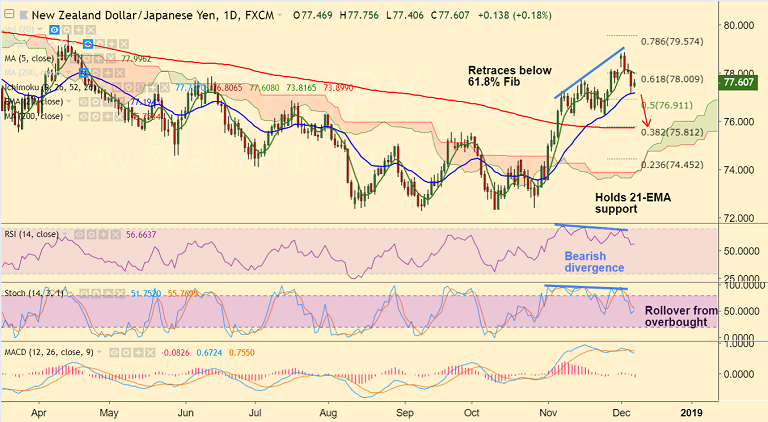
NZD/JPY chart on Trading View used for analysis
- NZD/JPY trades 0.17% higher on the day at 77.59 at the time of writing.
- The pair has held support at 21-EMA on Thursday's trade and edged higher.
- Break below 21-EMA will see weakness. Scope for dip till 200-DMA at 75.75.
- Technical studies on weekly charts is biased higher. But we see some weakness on the dailies.
- Price action has broken below 5-DMA and 5-DMA has turned. RSI and Stochs are biased lower after rollover from overbought levels.
- We see bearish divergence on RSI and Stochs which adds to the bearish bias.
Support levels - 77.19 (21-EMA), 76.26 (Nov 26 low), 75.75 (200-DMA)
Resistance levels - 78 (5-DMA), 78.86 (Dec 4 high), 79
Recommendation: Good to go short on break below 21-EMA, SL: 78, target 76.30/ 76/ 75.75
For details on FxWirePro's Currency Strength Index, visit http://www.fxwirepro.com/currencyindex.


