


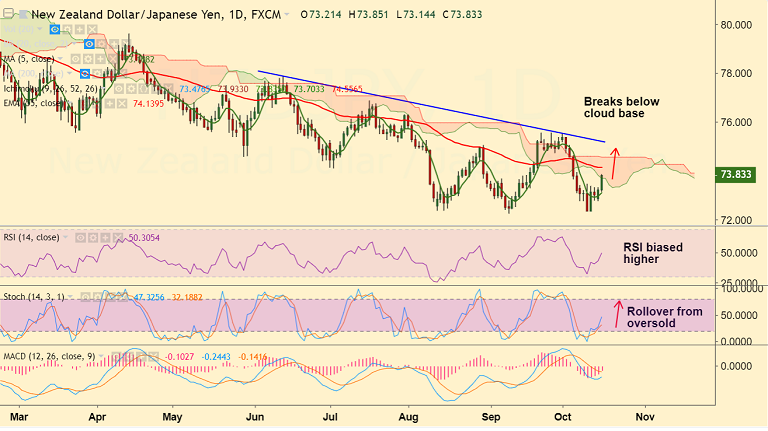
NZD/JPY chart on Trading View used for analysis
- NZD/JPY spikes higher, trades 0.85% higher on the day at 73.82 at the time of writing.
- The pair has broken into daily cloud and we see scope for further upside.
- Technical indicators on daily charts have turned bullish.
- Oscillators support upside. RSI is biased higher, Stochs have rolled over from oversold levels.
- 5-DMA has turned and offers immediate support at 73.11, break below negates a upside bias.
- Next major resistance lies at 55-EMA at 74.14. Violation there could see further gains.
Support levels - 73.74 (21-EMA), 73.12 (5-DMA), 72.25 (Sept 12 low)
Resistance levels - 74.15 (55-EMA), 74.90 (110-EMA), 75
Recommendation: Good to go long on dips around 73.75/85, SL: 73.10, TP: 74.15/ 74.90
For details on FxWirePro's Currency Strength Index, visit http://www.fxwirepro.com/currencyindex.


