


 FxWirePro: AUD/USD gains some ground but outlook is bearish
  FxWirePro: GBP/AUD drifts lower after BOE rate decision
  US Magnificent 7 Stocks Trend Score: Amazon & Microsoft Hit Extreme Bullish (+100) as Meta Drops to -100 — Key Resistance & Support Watchlist
  FxWirePro: GBP/NZD remains weak, eyes 38.2%fib support
  AUD/JPY Slips Below 112 as BOJ Intervention Sparks Bearish Momentum: Sell the Rallies
  FxWirePro: EUR/ AUD dips below 1.6400 level, focus on near term support
  FxWirePro- Major Pair levels and bias summary
  FxWirePro: NZD/USD consolidates overnight gains, but loses momentum
  FxWirePro: GBP/NZD remains weak, eyes 38.2%fib support
  FxWirePro: USD/CAD retreats after Canada posts stronger-than-expected GDP growth
  AUDJPY Volatile After Massive Sell-Off: Sell Rallies at 113, Targeting 110 as Bearish Momentum Surges
  Major European Indices Score Extremely Bullish: DAX Eyes 26000, CAC Targets 8600, FTSE100 at 11000 – Key Levels to Watch
  FxWirePro: GBP/AUD bears maintain upper hand
  FxWirePro: USD/ZAR gains as stronger dollar outweighs upbeat South Africa's trade surplus
  US Magnificent 7 Stocks Trend Score: Amazon & Microsoft Hit Extreme Bullish (+100) as Meta Drops to -100 — Key Resistance & Support Watchlist
  NZDJPY Bullish Rebound: Buy Dips as EMAs Align for 97 Target
  FxWirePro: GBP/USD rises as soft US data pressures dollar


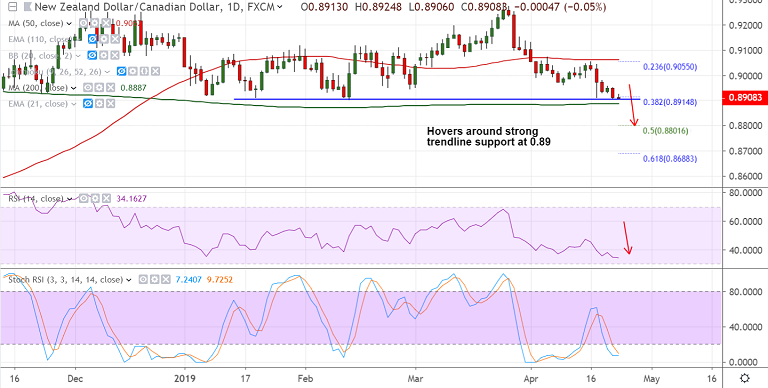
NZD/CAD chart - Trading View
Fundamental Factors:
- The Canadian dollar strengthened on the back of resurgent oil prices
- Oil prices reached fresh 2019 highs after President Trump said the US wouldn't renew Iranian oil waivers.
- Further, speculations that China will soon opt out of heavy stimulus is weighing on the antipodeans
Technical Analysis:
- NZD/CAD retraces from session highs at 0.8924
- Price action below major EMAs and daily cloud
- Momentum with the bears, MACD and DMI support weakness
- Downside finds strong support at 50W SMA at 0.8908
- Technical indicators on weekly charts are also bearish
Support levels - 0.8908 (50W SMA), 0.8887 (200-DMA), 0.8801 (50% Fib)
Resistance levels - 0.8936 (5-DMA), 0.90 (21-EMA), 0.9036 (55-EMA)
Recommendation: Stay short on break below 200-DMA (0.8887), SL: 0.8940, TP: 0.88/ 0.8688 (61.8% Fib)
For details on FxWirePro's Currency Strength Index, visit http://www.fxwirepro.com/currencyindex.

- News

- Economy

- Central Banks
- Investing
- Research
- Roundups
- Digital Currency
- Insights
- Technical Analysis
- Technology
- Business
- Law
- Health
- Nature
- Fintech
- Science
- Topic
- Opinions
- ©Econometrics LLC . All Rights Reserved.
FxWirePro: NZD/CAD Trade Idea
Tuesday, April 23, 2019 6:13 AM UTC
Editor's Picks


- Market Data
Most Popular


