


 Gold Surges Past $4150 on Dovish Fed Signals and Weak Jobs Data; Bullish Outlook Prevails
  State of emergency in Crimea as Ukraine focuses pressure on ‘jewel in Putin’s crown’
  Michael Burry Shorts Tesla at $416 as AI and Semiconductor Bearish Bets Expand
  Buy the Dip: Gold Holds Strong at $3980, Targets $4150
  Smartphones are helping filmmakers tell the stories the movie industry overlooks
  JPMorgan Cuts Gold Price Forecast, Sees Bullion Reaching $4,500 by End of 2026
  In a rebuke to Trump, the Supreme Court rules that birthright citizenship is the law of the land
  Goldman Sachs Raises USD/JPY Forecast, Sees Yen Weakness Persist Through 2027
  Goldman Sachs Flags 3 Key Risks Ahead of Europe’s Earnings Season
  Alcohol is one of the most dangerous drugs, yet its presence is ubiquitous in social settings and celebrations


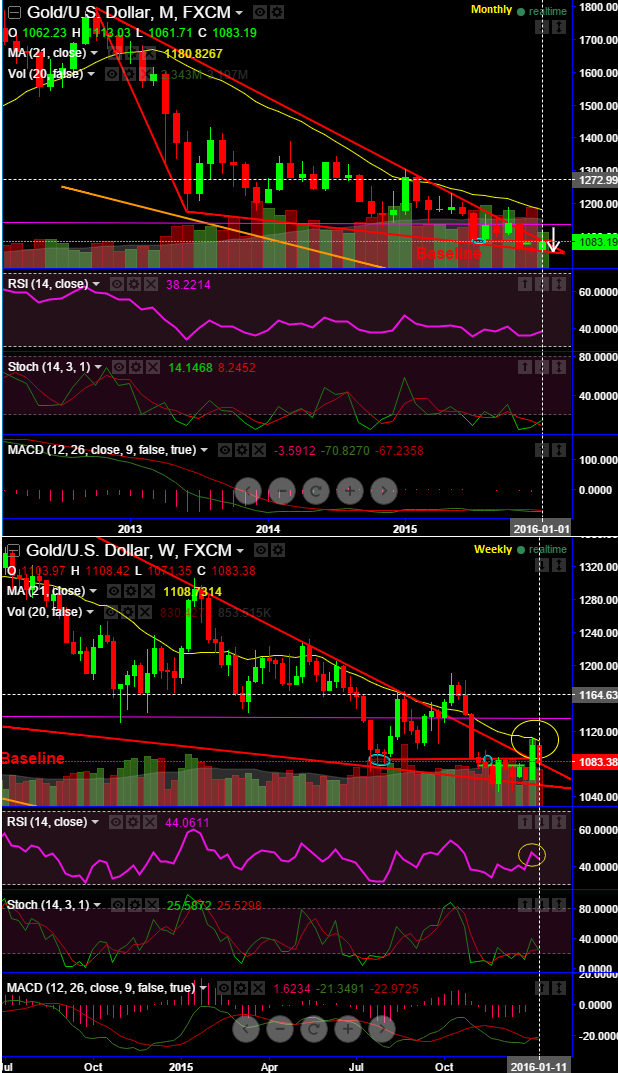
On monthly plotting XAUUSD has dropped back below sloping trend line of descending triangle to the current levels of 1083.14.
Weekly price tested 21DMA as resistance and rejected at 1108.42. that is where divergence is evidenced on leading oscillators.
We don't think prevailing price bounces to sustain in long run, see gold and silver struggled and rejected to break out and sustain strong trend line resistance at 1102 region on monthly charts.
One can only be bullish above convincing break these levels on monthly charts. Although both weekly and monthly RSI oscillators signal bullish convergence to approach this level we are not carrying adding longs without a decisive break out at above mentioned levels.
However, observe the price actions on confirmed continuance above or below moving average curve.
Prices above this lagging indicator help us understand the ability to catch a move above or below and remain in a move and develops a sustained move.
On the Comex division of the NYME, gold futures for February delivery were inched up 0.88% at 1,083.00.
The February contract ended Thursday's session 1.24% lower at 1,073.60 an ounce.
Futures were likely to find support at 1,063.20, the lows of January 4 and resistance at 1,091.50, (yesterday's highs).

- News

- Economy

- Central Banks
- Investing
- Research
- Roundups
- Digital Currency
- Insights
- Technical Analysis
- Technology
- Business
- Law
- Health
- Nature
- Fintech
- Science
- Topic
- Opinions
- ©Econometrics LLC . All Rights Reserved.
FxWirePro: Gold’s interim upswings unlikely to sustain - slides underway as bears lingering on sloping trend line of descending triangle
Friday, January 15, 2016 9:58 AM UTC
Editor's Picks


- Market Data
Most Popular


