


 FxWirePro- Major Pair levels and bias summary
  FxWirePro- Woodies pivot (Major)
  FxWirePro: USD/CAD positions for another climb, eyes 1.4150 level
  FxWirePro: EUR/NZD firms after ECB holds rates steady at 2.25%
  Crypto Bias Report: Trend Signals and Top Bullish Picks
  FxWirePro: GBP/USD downtrend loses steam but outlook still bearish
  FxWirePro- Major Crypto levels and bias summary
  Major Pairs Action Bias: USDCHF Emerges Extremely Bullish as EURUSD and GBPUSD Turn Deeply Bearish
  JPY Action Bias: USDJPY, EURJPY, and CADJPY Emerge as Top Extremely Bullish Picks
  FxWirePro- Major Crypto levels and bias summary
  AUDJPY Extends Four-Day Rally on Yen Weakness: Bullish Dip-Buy Eyes 117-118
  FxWirePro: GBP/AUD under pressure as pound continues to weaken
  FxWirePro: USD/ZAR retreats slightly but bias is bullish
  FxWirePro: GBP/NZD gains some ground but outlook is bearish
  FxWirePro:USD/JPY hovers near a four-decade low
  FxWirePro: AUD/USD uptrend loses steam, remains on bearish path


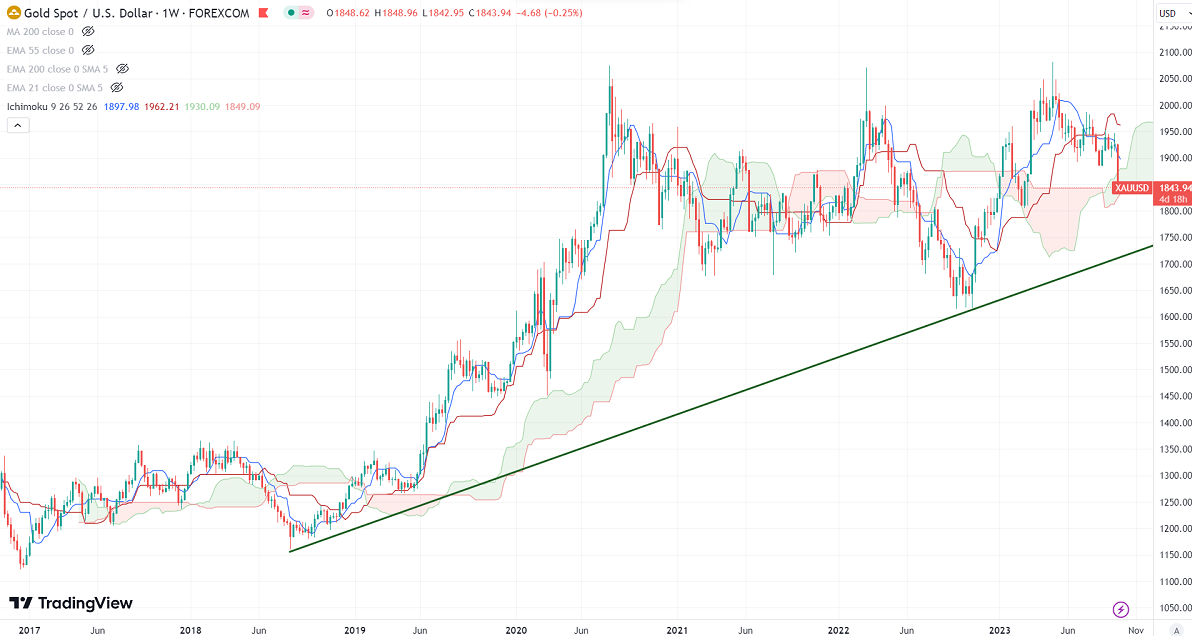
Ichimoku Analysis (Weekly chart)
Tenken-Sen- $1909.40
Kijun-Sen- $1963.90
Gold was the worst performer the previous week on surging US treasury yield. It hit a low of $1842.95 and is currently trading at around $1844.21.
US annual PCE inflation advanced 3.9% in August, in line with estimates. Every month, Personal consumption expenditure rose 0.1%, below the estimate of 0.20%.
US real GDP grew at an annual rate of 2.1% in Q2 as expected. The number of people who have filed for unemployment benefits rose to 204K in the week ended September 23rd, 2023, compared to a forecast of 215000. The University of Michigan consumer sentiment dropped to 68.1 in Sep, from 69.5 in Aug.
US dollar index- Bullish. Minor support around 104.40/103.79. The near-term resistance is 107/108.
According to the CME Fed watch tool, the probability of a 25 bpbs rate hike in Nov increased to 30.9% from 18.3% a day ago.
The US 10-year yield showed a minor pullback of 2.5% on upbeat US economic data. The US 10 and 2-year spread narrowed to -46.6% from -75%.
Factors to watch for gold price action-
Global stock market- Bearish (positive for gold)
US dollar index - Bullish (negative for gold)
US10-year bond yield- Bullish (negative for gold)
Technical:
The near–term support is around $1840, a break below targets of $1830/$1800. The yellow metal faces minor resistance around $1860 and a breach above will take it to the next level of $1885/$1900/$1920.
It is good to sell on rallies around $1862-63 with SL around $1880 for TP of $1800.


