


 NZDJPY Bullish Dip-Buy Setup: 93.60 Support Unlocks Path to 97
  FxWirePro: GBP/AUD bears maintain upper hand
  FxWirePro: GBP/NZD downside pressure builds, key support levels in focus
  AUDJPY Extends Four-Day Rally on Yen Weakness: Bullish Dip-Buy Eyes 117-118
  FxWirePro: AUD/USD uptrend loses steam, remains on bearish path
  FxWirePro: EUR/AUD neutral in the near term, scope for downward resumption
  Major Pairs Action Bias: USDCHF Emerges Extremely Bullish as EURUSD and GBPUSD Turn Deeply Bearish
  FxWirePro- Major Crypto levels and bias summary
  FxWirePro: GBP/USD downtrend loses steam but outlook still bearish
  FxWirePro: GBP/AUD under pressure as pound continues to weaken
  FxWirePro: USD/CAD edges lower but bullish outlook persists
  FxWirePro- Major Pair levels and bias summary
  FxWirePro- Woodies pivot (Major)
  FxWirePro: USD/ZAR retreats slightly but bias is bullish
  JPY Action Bias: USDJPY, EURJPY, and CADJPY Emerge as Top Extremely Bullish Picks
  FxWirePro: GBP/NZD gains some ground but outlook is bearish


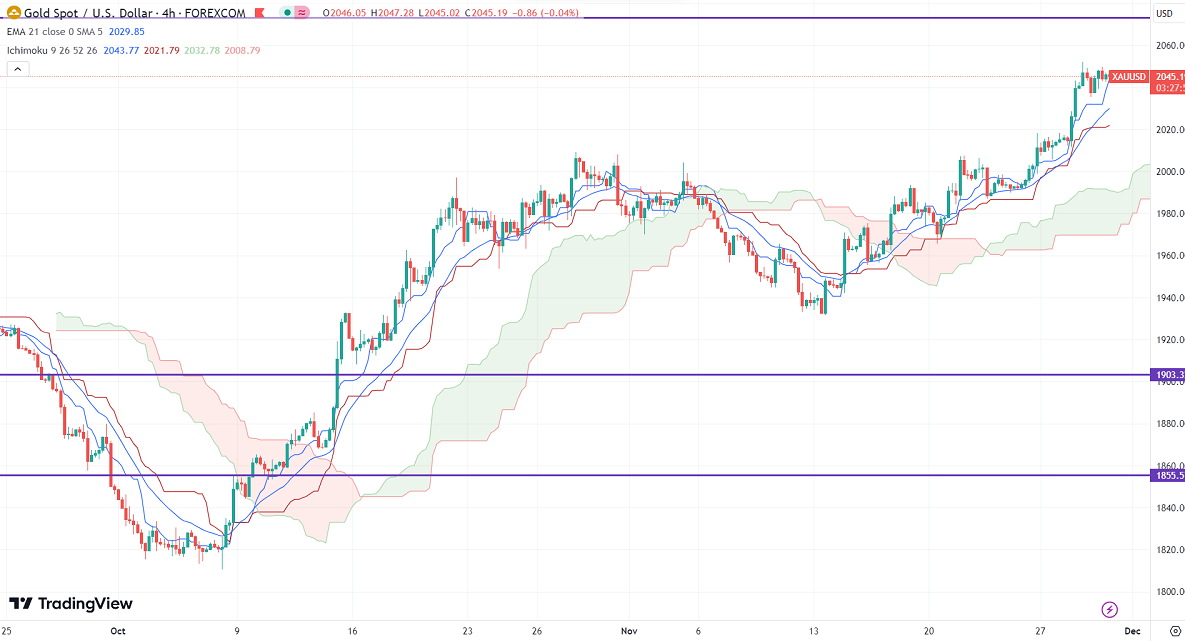
Ichimoku Analysis (4 hour chart)
Tenken-Sen- $2037.91
Kijun-Sen- $2020.95
Gold trades in a narrow range after hitting a month high. It hit a high of $2052.04 yesterday and is currently trading around $2045.24.
US GDP grew at an annualized rate of 5.2% in Q3, compared to a forecast of 5%.
Major economic data for the day
Nov 30th, 2023, Core PCE index (1:30 pm GMT)
US dollar index- Bearish. Minor support around 102/100. The near-term resistance is 103/104.50.
According to the CME Fed watch tool, the probability of a no-rate hike in Dec decreased to 97.10% from 99.70% a day ago.
The US 10-year yield trades flat ahead of US PCE data. The US 10 and 2-year spread narrowed to -38% from -52%.
Factors to watch for gold price action-
Global stock market- Bullish (negative for gold)
US dollar index - Weak (positive for gold)
US10-year bond yield- Bearish (Positive for gold)
Technical:
The near–term support is around $2030, a break below targets of $1980/$1965/$1950/$1929/$1900/$1850. The yellow metal faces minor resistance around $2050 and a breach above will take it to the next level of $2070/$2100.
It is good to buy on dips around $2020 with SL around $2000 for TP of $2070.


