


 Major Pairs Action Bias: USDCHF Emerges Extremely Bullish as EURUSD and GBPUSD Turn Deeply Bearish
  FxWirePro: EUR/AUD neutral in the near term, scope for downward resumption
  FxWirePro: GBP/USD slips as middle east tensions and oil surge pressure pound
  FxWirePro: GBP/NZD downside pressure builds, key support levels in focus
  FxWirePro: AUD/USD uptrend loses steam, remains on bearish path
  EUR/USD Slides After ECB Hold, Bearish Technicals Favor Rally Fades
  FxWirePro: USD/ZAR retreats slightly but bias is bullish
  FxWirePro: USD/CAD edges lower but bullish outlook persists
  AUDJPY Extends Four-Day Rally on Yen Weakness: Bullish Dip-Buy Eyes 117-118
  FxWirePro: USD/CAD positions for another climb, eyes 1.4150 level
  FxWirePro:USD/JPY hovers near a four-decade low
  FxWirePro: EUR/NZD downside pressure builds, key support level in focus
  BTC, ETH, SOL, XRP, and BNB: Major Crypto Pairs Stay Neutral
  NZDJPY Bullish Dip-Buy Setup: 93.60 Support Unlocks Path to 97
  FxWirePro- Woodies pivot (Major)
  FxWirePro: USD/ZAR surges as rand slumps after SARB rate hold surprise


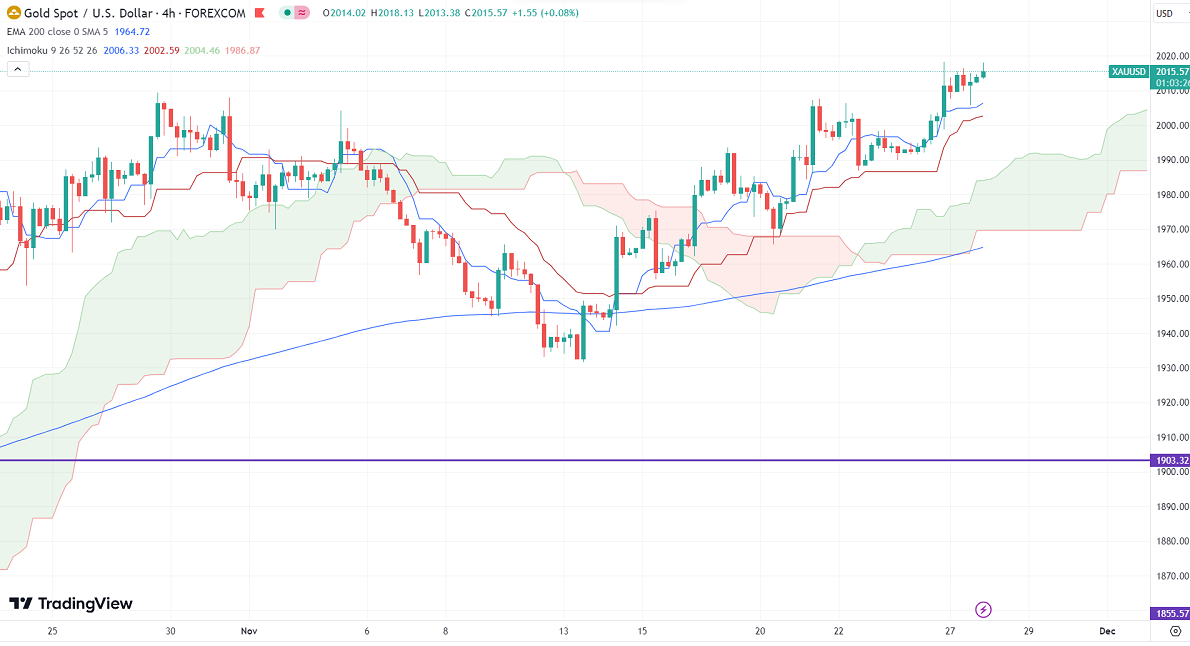
Ichimoku Analysis (4 hour chart)
Tenken-Sen- $2005.19
Kijun-Sen- $2002.19
Gold hits six-month high on weak US dollar. It hit a high of $2018.23 yesterday and is currently trading around $20017.71.
US new home sales in Oct 2023 came at 679000 compared to a forecast of 725000.
Major economic data for the day
Nov 28th 2023, S&P/CS Composite-20 HPI y/y (2:00pm GMT)
CB consumer confidence (3:00 pm GMT)
Richmond Manufacturing Index
US dollar index- Bearish. Minor support around 103/102. The near-term resistance is 104/105.
According to the CME Fed watch tool, the probability of a no-rate hike in Dec increased to 98.1% from 95.50% a day ago.
The US 10-year yield lost more than 2.5% from a minor top of 4.50%. The US 10 and 2-year spread widened to -46.7% from -16%.
Factors to watch for gold price action-
Global stock market- Bullish (negative for gold)
US dollar index - Weak (positive for gold)
US10-year bond yield- Bearish (Positive for gold)
Technical:
The near–term support is around $2000, a break below targets of $1980/$1965/$1950/$1929/$1900/$1850. The yellow metal faces minor resistance around $2020 and a breach above will take it to the next level of $2030/$2050.
It is good to buy on dips around $1980-81 with SL around $1968 for TP of $2020.


