


 Bitcoin Tumbles Below $60,000 Amidst Persistent ETF Outflows
  FxWirePro: GBP/USD recovers slightly from early decline but bears are not done yet
  Part II — The listing: NFTs as bottle-stamps, and a vault the family is in no rush to sell
  FxWirePro: USD/CAD steadies around 1.4220 ,retains bid one
  Europe Heatwave Creates Growth Opportunity for Carrier, Trane, and Johnson Controls, Citi Says
  FxWirePro- Major Pair levels and bias summary
  FxWirePro:USD/CAD uptrend loses steam but outlook still bullish
  FxWirePro- Major Pair levels and bias summary
  EURUSD Recovers Amidst Dollar Weakness, Eyeing Key Resistance Levels
  Buy the Dip: Gold Holds Strong at $3980, Targets $4150
  FxWirePro: GBP/NZD sustains gains as uptrend remains strong
  FxWirePro: GBP/AUD gaining momentum for a move towards 1.9350 level
  FxWirePro: GBP/USD gains some ground but outlook still bearish


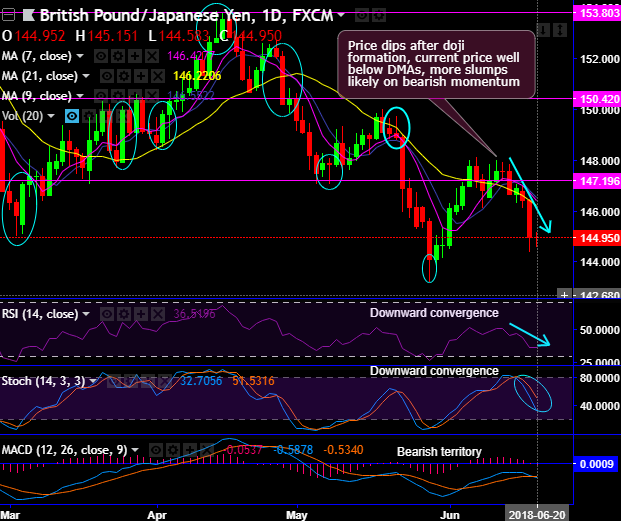
Chart and candlestick patterns occurred: Long-legged doji has occurred at 147.568 levels, one can observe the steep price dips below DMAs ever since the occurrence of this bearish pattern (refer daily plotting).
While the intermediate trend was spiking through rising channel (refer weekly chart), where shooting star candle occurs at 150.201 levels and evidences considerable slumps below EMAs but cushions at channel support and attempted to bounce back several times.
But for now, bears on weekly terms have managed to breach below channel support, consequently, the current price tumbles well below EMAs, but dragonfly doji occurs at 146.099 levels and shooting star pops up at 146.885 level to counter-rallies. Both leading as well as lagging indicators have been bearish bias (refer weekly chart).
Ever since the occurrence of the breach below channel support, the price has been restrained below 21EMA and the trend sentiment has bearish (on weekly terms).
Both momentum oscillators (RSI & stochastic curves) have shown downward convergence on both timeframes that indicate the strength and the momentum in the bearish trend.
Trade tips:
On trading grounds, at spot reference: 144.942 levels, we advocate buying tunnel option spreads using 145.315 as upper strikes and 144.411 as lower strikes.
Alternatively, one can initiate shorts in futures contracts of mid-month tenors with a view to arresting potential downside risks as the underlying pair is on the verge of extending price dips which is 3w lows.
Currency Strength Index: FxWirePro's hourly GBP spot index is flashing -107 (which is bearish), while hourly JPY spot index was at 142 (bullish) while articulating (at 07:32 GMT). For more details on the index, please refer below weblink:
http://www.fxwirepro.com/currencyindex
The above indices are also conducive to the derivatives strategy as advocated above.
FxWirePro launches Absolute Return Managed Program. For more details, visit:


