


 Elon Musk is remaking the world, like Henry Ford before him – but more dangerously
  Smartphones are helping filmmakers tell the stories the movie industry overlooks
  Morgan Stanley Names BAE Systems Top European Defence Stock Despite Lower Price Target
  Vietnam’s population hit the 100 million milestone. Where’s it headed?
  In a rebuke to Trump, the Supreme Court rules that birthright citizenship is the law of the land
  Goldman Sachs Flags 3 Key Risks Ahead of Europe’s Earnings Season
  AI can be a personal trainer in your pocket – but is it safe?
  Alcohol is one of the most dangerous drugs, yet its presence is ubiquitous in social settings and celebrations
  Michael Burry Shorts Tesla at $416 as AI and Semiconductor Bearish Bets Expand
  Gold Surges Past $4150 on Dovish Fed Signals and Weak Jobs Data; Bullish Outlook Prevails
  Buy the Dip: Gold Holds Strong at $3980, Targets $4150


With the below technical reasoning, we recommended arresting potential downside risks of this pair by hedging through Put Ratio back Spread. The short term ITM shorts have already fetched assured gains and were exactly suitable for short term upswings then (with shorter expiries, probably 4-5 days), so thereby premiums of shorts on one lot of (1%) In-The-Money put option can be blocked as a certain yields.
Thereafter, now it's time for longs set up in put back spreads, we expect the underlying currency GBPJPY to make a further move on the downside. So, longs on 2 lots of At-The-Money -0.50 delta puts would function effectively.
How does it favor hedging objective: The short ITM puts funds to the purchase of the greater number of long puts and the position is entered for no cost or a net credit. The delta of combined positions should be around -0.39 with negative theta value. If a disciplined hedger strictly follows all these mathematical computations, then irrespective of market sentiments, one can be rest assured with the riskfree exposures in his foreign trade.
Technical watch:
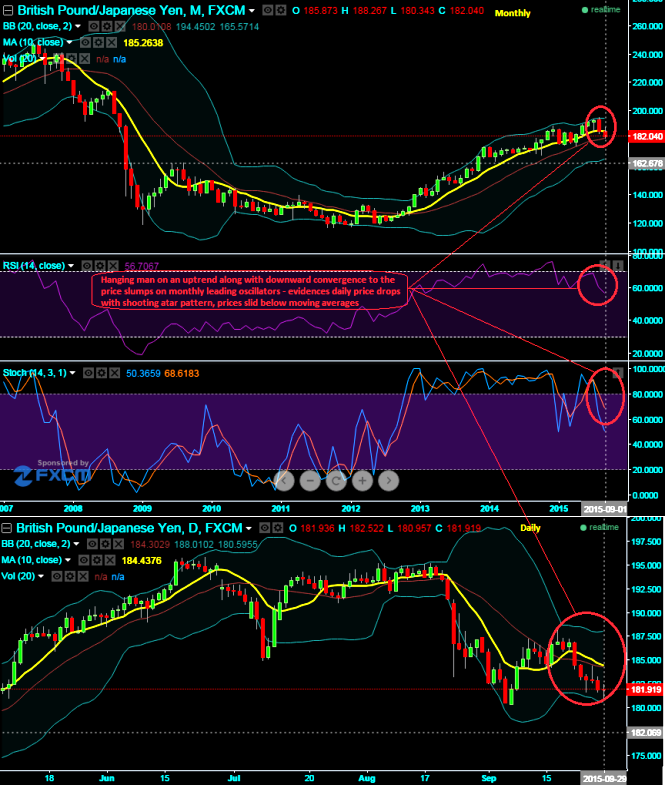
The formation of hanging man pattern candle on peaks of uptrend at around 193.456 levels alerts us the bearish trend on monthly chart. This hanging man followed by two long real body red candles would reveal a medium term downtrend direction. It is important to emphasize that the hanging man pattern is a warning of potential price change, not a signal, in and of itself, to go short.
See daily price effects after above mentioned bearish pattern. Overall pattern on the pair fixes it bearish view for a target of 177.125, if it breaks this level further it may even extend the slumps up to 175 levels. In addition to that huge volumes are popping up to show bearish sentiments, while leading oscillators (RSI & slow stochastic) show convergence with dipping prices at current levels. RSI is currently trending at 58.2336, while %D crossover above 80 levels signifies the selling momentum is intensifying.

- News

- Economy

- Central Banks
- Investing
- Research
- Roundups
- Digital Currency
- Insights
- Technical Analysis
- Technology
- Business
- Law
- Health
- Nature
- Fintech
- Science
- Topic
- Opinions
- ©Econometrics LLC . All Rights Reserved.
FxWirePro: GBP/JPY put backspreads capitalizing upon hanging man formation
Tuesday, September 29, 2015 9:54 AM UTC
Editor's Picks


- Market Data
Most Popular


