


 Moody's Upgrades Argentina's Credit Rating Amid Economic Reforms
  Trump’s "Shock and Awe" Agenda: Executive Orders from Day One
  Bank of America Posts Strong Q4 2024 Results, Shares Rise
  US Futures Rise as Investors Eye Earnings, Inflation Data, and Wildfire Impacts
  European Stocks Rally on Chinese Growth and Mining Merger Speculation
  Global Markets React to Strong U.S. Jobs Data and Rising Yields
  UBS Projects Mixed Market Outlook for 2025 Amid Trump Policy Uncertainty
  Lithium Market Poised for Recovery Amid Supply Cuts and Rising Demand
  Moldova Criticizes Russia Amid Transdniestria Energy Crisis
  Gold Prices Slide as Rate Cut Prospects Diminish; Copper Gains on China Stimulus Hopes
  Geopolitical Shocks That Could Reshape Financial Markets in 2025
  Stock Futures Dip as Investors Await Key Payrolls Data
  S&P 500 Relies on Tech for Growth in Q4 2024, Says Barclays
  Wall Street Analysts Weigh in on Latest NFP Data
  China's Refining Industry Faces Major Shakeup Amid Challenges
  Indonesia Surprises Markets with Interest Rate Cut Amid Currency Pressure


Ahead of RBNZ’s monetary policy that is scheduled for next week, NZDUSD speculators began paring extreme short positions, signalling NZD upside potential near-term. However, there is major event risk to navigate during the next week.
NZD is the preferred high-beta short within G10 gamut at present as it’s the only DM economy where the market prices a realistic chance of rate cuts over the coming year (around 10bp is priced by mid-19).
NZD is no longer expensive in outright terms (the REER is in line with a long-term average), that being said it is quite a bit more expensive than large parts of EM yet vulnerable to the same pressure from tighter US monetary policy with the additional kicker of course that NZD is now negative carry.
The catalyst for the reduction in short positions has been the improved mood in risky asset markets over the past two weeks (e.g. equities higher, US dollar lower). Today’s strong NZ GDP data will add to arguments for exiting shorts, and we would not be surprised to see the NZD trading at 0.6725 during the week ahead.
However, there are key events near term which could surprise the NZD either way. The Fed on Wed is likely to increase its policy rate by 25bp and signal more to come. That much is priced in, so the USD reaction will probably depend on how hawkish the dot-plot is.
Westpac used NZDUSD futures speculator positioning data which is published by the CFTC - a regulatory agency for the US derivative markets. This dataset dates back to 2006, with weekly frequency. Positioning is surveyed on Tuesday and published the following Friday.
CFTC publishes two reports which provide information about speculative activity - Legacy, and Traders in Financial Futures. From these we extracted the non- commercial and leveraged categories, respectively, and averaged these.
They standardised the data by expressing positions as a share of open interest, since in the early history, NZDUSD futures volumes were much lower. We then converted these standardised values to z-scores.
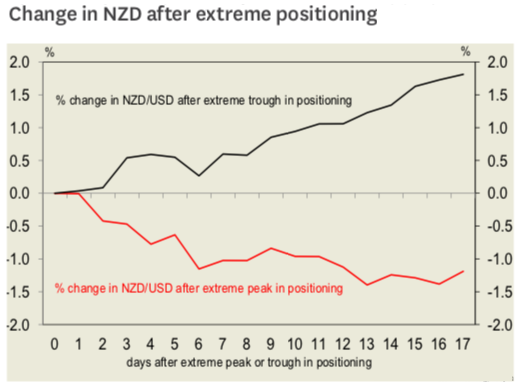
The statistical analysis revealed that extreme peaks in positioning precede a decline in the NZDUSD, and the relationship is statistically significant (p-value 0.07).
On average, NZDUSD declines 1.5% 16 days after the positioning peak (refer red line in above chart). Extreme troughs in positioning precede an average 1.6% rise in NZDUSD, 16 days after the trough. The result is statistically significant (p-value 0.05).
Initiated short in NZDUSD at 0.6610 August 10th. Marked partial volumes at +0.83%, maintained shorts in . Courtesy: Westpac
Currency Strength Index: FxWirePro's hourly NZD is inching at 70 (which is bullish), USD spot index is flashing at -127 levels (which is bearish), while articulating (at 11:29 GMT). For more details on the index, please refer below weblink:


