


 Fed May Resume Rate Hikes: BofA Analysts Outline Key Scenarios
  Moldova Criticizes Russia Amid Transdniestria Energy Crisis
  FxWirePro- Woodies pivot (Major)
  Mexico's Undervalued Equity Market Offers Long-Term Investment Potential
  FxWirePro: AUD/USD climbs as US-Iran peace deal sparks risk rally
  Peace Dividend Powers NZDJPY Past 93.50 — Bulls Set Sights on 96.15 Target
  2025 Market Outlook: Key January Events to Watch
  Geopolitical Easing Fuels AUDJPY Rally Toward 115 — Buy Dips at 113
  China's Refining Industry Faces Major Shakeup Amid Challenges
  U.S. Banks Report Strong Q4 Profits Amid Investment Banking Surge
  FxWirePro: GBP/USD slides toward critical support market reassesses UK political transition
  FxWirePro: GBP/NZD stuck in range but outlook is bullish
  FxWirePro- Major Pair levels and bias summary
  FxWirePro: USD/CAD steadies around 1.3990 ,retains bid one
  S&P 500 Relies on Tech for Growth in Q4 2024, Says Barclays


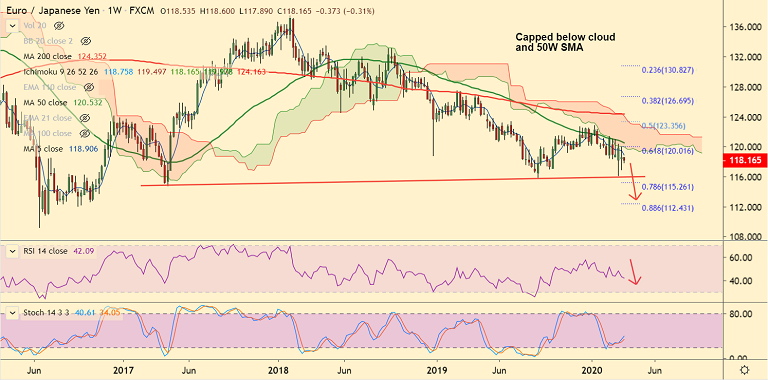
EUR/JPY chart - Trading View
EUR/JPY was trading 0.36% lower on the day at 118.16 at around 05:40 GMT, after closing 0.17% higher in the previous session.
Fears of a coronavirus-led slowdown in the global economy were bolstered after the US Senate's failure to push forward the rescue package.
The pair has failed to break past 21W EMA and weekly cloud and 5W SMA has turned sharply lower.
GMMA indicator shows major and minor trend on the weekly charts is strongly bearish.
Indicators on the daily charts have turned neutral, but the pair has completed a 'Death Cross' on the daily charts which could plummet prices.
Lower Bollinger band at 116.86 is immediate support ahead of major trendline support at 116. Break below eyes 78.6% Fib at 115.26.
On the flipside 21-EMA is immediate resistance at 118.84. Break above 50W SMA (120.53) could support near-term upside.
Support levels - 116.86 (Lower BB), 116 (Trendline)
Resistance levels - 118.84 (21-EMA), 120.53 (50W SMA)


