


 FxWirePro:USD/JPY climbs back above 160.00 after BOJ rate decision
  NZDJPY Bullish Rebound: Buy Dips as EMAs Align for 97 Target
  US Magnificent 7 Stocks Trend Score: Amazon & Microsoft Hit Extreme Bullish (+100) as Meta Drops to -100 — Key Resistance & Support Watchlist
  FxWirePro: AUD/USD gains some ground but outlook is bearish
  FxWirePro- Woodies pivot (Major)
  FxWirePro: GBP/AUD bears maintain upper hand
  FxWirePro- Major Pair levels and bias summary
  FxWirePro: EUR/ AUD dips below 1.6400 level, focus on near term support
  FxWirePro: GBP/NZD remains weak, eyes 38.2%fib support
  Major European Indices Score Extremely Bullish: DAX Eyes 26000, CAC Targets 8600, FTSE100 at 11000 – Key Levels to Watch
  FxWirePro: GBP/NZD remains weak, eyes 38.2%fib support
  FxWirePro: GBP/USD rises as soft US data pressures dollar
  AUD/JPY Slips Below 112 as BOJ Intervention Sparks Bearish Momentum: Sell the Rallies
  US Magnificent 7 Stocks Trend Score: Amazon & Microsoft Hit Extreme Bullish (+100) as Meta Drops to -100 — Key Resistance & Support Watchlist
  JPY Currency Meter Signals: NZDJPY Bullish (+25) vs CHFJPY (-100) – These Pairs Could Move Next
  Major FX Action Bias & US Market Sentiment: NZD/USD (Extremely Bullish) & AUD/USD (Bullish) Watchlist
  Nikkei Surges Past 65,000 on Suspected Yen Weakness: Tech Giants Like Advantest and NEC Lead Explosive Gains


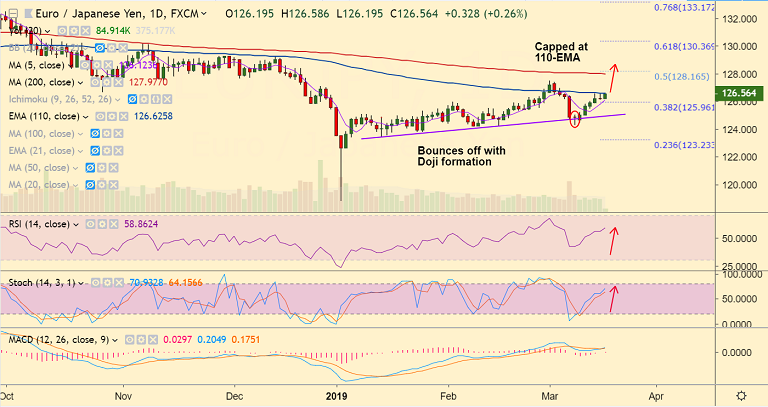
EUR/JPY chart - Trading View
- EUR/JPY is trading 0.27% higher on the day at 126.58 at 0745 GMT.
- The pair has ignored a 'Doji' formation on Friday's candle and has resumed upside.
- The pair remains capped at 110-EMA, but technical indicators continue to show bullish bias.
- Stochs and RSI are sharply higher and MACD is on verge of bullish crossover on signal line.
- Breakout at 110-EMA will see gains upto 200-DMA. Further momentum could see test of 61.8% Fib at 130.36.
- On the downside, strong support is seen in the 126.75 to 128.85 zone. Break below to see further weakness.
Support levels - 126.12 (5-DMA), 125.96 (38.2% Fib), 125.82 (21-EMA)
Resistance levels - 126.62 (110-EMA), 127.50 (Mar 1 high), 128 (200-DMA)
Recommendation: Watch out for break above 110-EMA to go long, SL: 126. TP: 127/ 127.50/ 128
For details on FxWirePro's Currency Strength Index, visit http://www.fxwirepro.com/currencyindex.


