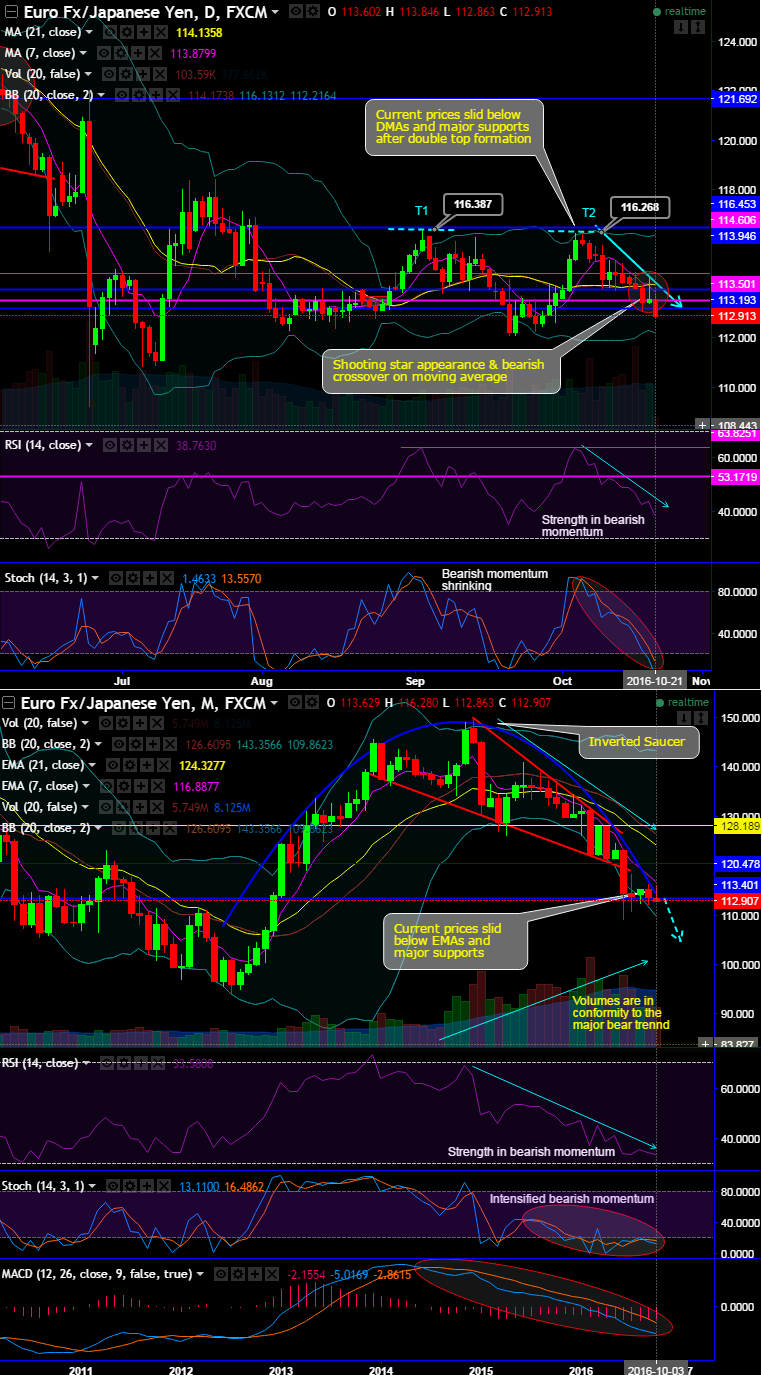
The pair forms the double top pattern with the 1st top at 116.365 levels and 2nd top at 116.280 levels on daily charts.
The current prices have slid below DMAs and major supports after double top formation.
Subsequently, the shooting star appearance at 113.602 & 7DMA crossing below 21DMA which is deemed as bearish crossover signifies the more weakness in this pair.
While the price behavior on monthly chart consistently rejected at inverse saucer to push further downside, the current prices have also slid below EMAs and major supports of 113.401, the sustenance below would prolong the major downtrend.
Currently, on daily plotting RSI (14) converging below 39 levels on daily and below 34 levels on monthly terms (while articulating).
While %D crossover even below oversold zones signals the buying interest is completely shrunk away and selling momentum is still intensified.
Please be noted that the prices have been slipping through lower Bollinger band and rejecting upswings at 7EMA where it has lost buying interest.
The pair is still steaming up with heaps of other bearish indications by leading oscillator on the monthly chart.
As stated earlier in our long-term trend analysis more downside targets are on the cards as the bears taking over the rallies to evidence every dips with ease and with huge volumes (see monthly charts for volumes conformity).
MACD and moving averages are indicative to the bear trend to prolong.
The most probable scenario would be that it may retest recent lows of 110.824 levels.
Trade tips: As a result of above technical reasoning, on speculative grounds we see one touch binary delta puts on every rally. This strategy is likely to fetch leveraged yields than spot FX and certain yields for targets up to 112.760 levels. This is just for an intraday trading perspective, but in long run, this is certainly not yet an ideal time for fresh longs.


