


 AUDJPY Weakness Deepens: Sell Rallies Toward 112 as Aussie Dollar Falters
  FxWirePro: NZD/USD edges lower, remains on back foot
  FxWirePro: USD/ZAR retreats but trend is still bullish
  FxWirePro: EUR/ AUD gains some ground , but remains on bearish path
  FxWirePro- Major Pair levels and bias summary
  EUR/JPY Holds Bullish Bias as Euro Extends Recovery
  Crypto Action Bias: ETHUSD Stands Out as the Bullish Pair to Watch
  FxWirePro: EUR/AUD outlook weaker on renewed downside pressure
  FxWirePro- Major Crypto levels and bias summary
  FxWirePro: GBP/NZD gains some ground but bias is still bearish
  FxWirePro: EUR/NZD up trend gains momentum but hurdles ahead
  FxWirePro: USD/CAD runs out of steam but maintains bullish outlook
  FxWirePro: USD/ZAR uptrend loses steam, remains on bullish path
  FxWirePro: USD/CAD gaining momentum for a move towards 1.4200 level
  FxWirePro- Woodies pivot (Major)


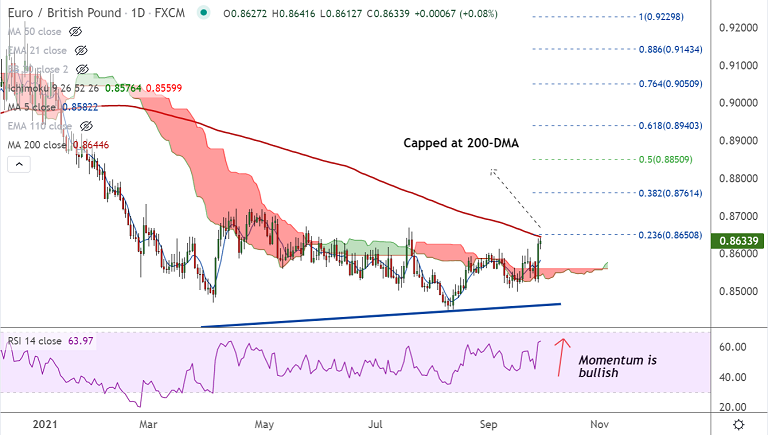
EUR/GBP chart - Trading View
Technical Analysis: Bias Bullish
- EUR/GBP was trading largely unchanged at 0.8626 at around 09:40 GMT
- The pair's stellar rise on Tuesday's trade has found stiff resistance at 200-DMA
- Momentum remains bullish on the daily and weekly charts
- Price action has shown a decisive break above 21-week EMA
- Volatility is also high and rising as evidenced by widening Bollinger Bands
Support levels - 0.8585 (110-EMA), 0.8566 (21-EMA), 0.8559 (55-EMA)
Resistance levels - 0.8644 (200-DMA), 0.8680 (55-week EMA), 0.8734 (110-week EMA)
Summary: EUR/GBP's stellar rally on Tuesday's trade is consolidating below 200-DMA resistance. Momentum is with the bulls, scope for further upside on break above 200-DMA. Next major bull target lies at 38.2% Fib at 0.8761.


