


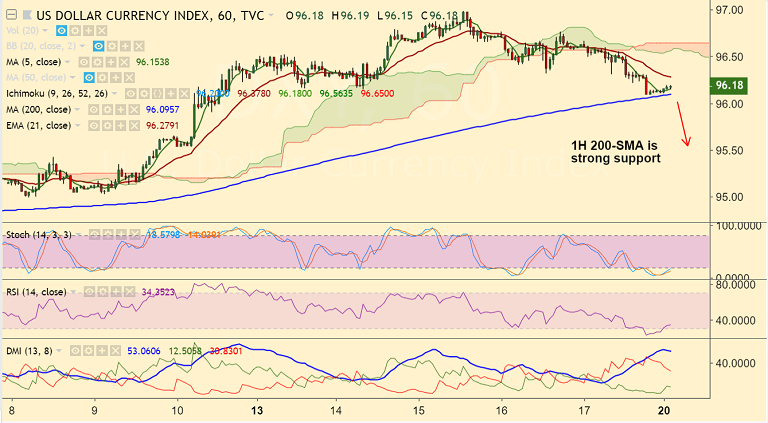
Refer DXY chart on Trading View
- The dollar index DXY has paused 2 straight sessions of downside, struggles to break below 96 mark.
- Technical indicators are neutral to slightly bearish on the intraday charts.
- We see strong support at 1H 200-SMA and weakness to extend only on break below.
- The index is extending downside from multi-month highs at 96.98 with a 'Shooting Star' formation.
- Price has broken below 5-DMA and break below 1H 200-SMA eyes 21-EMA at 95.62.
- RSI has shown a rollover from overbought levels and Stochs are on verge of a rollover too.
- Market sentiment improved on reports that the US and China are working towards a Trump/Xi meeting in November.
- Focus now on FOMC minutes (due Wednesday) which could provide additional information on participants’ concerns regarding US trade policy and the possible downside risks.
- On the data front focus shall be on: Existing home sales (Wednesday), Initial jobless claims (Thursday), New home sales (Thursday) and Durable goods orders (Friday).
Support levels - 96.09 (1H 200-SMA), 95.62 (21-EMA), 95
Resistance levels - 96.45 (5-DMA), 96.98 (Aug 15 high), 97
Call update: Our previous call (https://www.econotimes.com/FxWirePro-DXY-retraces-from-13-month-highs-at-9698-stay-short-on-break-below-9642-1H-100-SMA-1416700) has hit a roadblock.
Recommendation: Watch out for break below 1H 200-SMA for further weakness.
FxWirePro Currency Strength Index: FxWirePro's Hourly USD Spot Index was at -95.0195 (Bearish) at 0245 GMT. For more details on FxWirePro's Currency Strength Index, visit http://www.fxwirepro.com/currencyindex.


