


 FxWirePro: GBP/NZD stuck in range but outlook is bullish
  FxWirePro: GBP/USD slides toward critical support market reassesses UK political transition
  China's Refining Industry Faces Major Shakeup Amid Challenges
  Peace Dividend Powers NZDJPY Past 93.50 — Bulls Set Sights on 96.15 Target
  Moldova Criticizes Russia Amid Transdniestria Energy Crisis
  FxWirePro: GBP/AUD steadies around 0.9145 ,retains bid tone
  Oil Prices Dip Slightly Amid Focus on Russian Sanctions and U.S. Inflation Data
  UBS Projects Mixed Market Outlook for 2025 Amid Trump Policy Uncertainty
  Fed-ECB Policy Chasm Sends EURUSD Tumbling to 1.1375; Bearish Momentum Builds Toward 1.1300
  UBS Predicts Potential Fed Rate Cut Amid Strong US Economic Data
  Geopolitical Easing Fuels AUDJPY Rally Toward 115 — Buy Dips at 113
  FxWirePro- Woodies pivot (Major)
  US Futures Rise as Investors Eye Earnings, Inflation Data, and Wildfire Impacts
  Lithium Market Poised for Recovery Amid Supply Cuts and Rising Demand
  FxWirePro- Woodies pivot (Major)


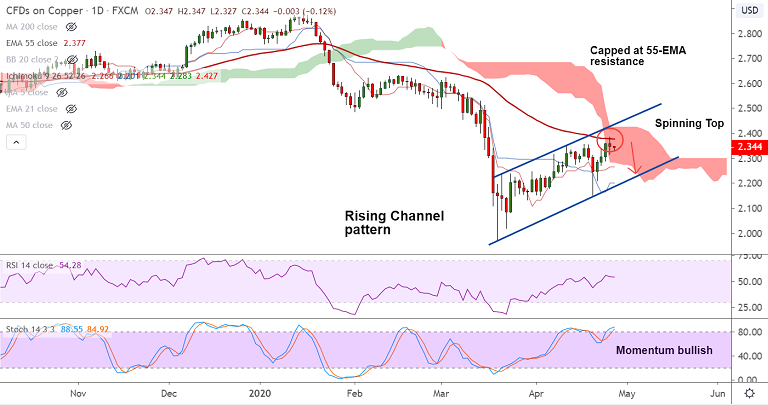
Copper chart - Trading View
Copper was trading 0.11% lower on the day at 2.344 at around 04:45 GMT.
Upside in the pair was capped at 55-EMA which is offering stiff resistance at 2.377.
A 'Spinning Top' formation on the daily candle on Monday suggests consolidation for the pair.
Intraday charts hold scope for upside as price action is above 200H MA and GMMA shows bullishness on the hourly charts.
Price action has edged higher from session lows at 2.327, holds support at 5-DMA.
The pair is extending trade in rising channel pattern and break above 55-EMA will see test of channel top at 2.435.
Failure at 55-EMA and retrace below cloud will negate upside bias.
Support levels - 2.328 (5-DMA), 2.302 (21-EMA)
Resistance levels - 2.377 (55-EMA), 2.435 (Channel top)


