


 FxWirePro- Major Crypto levels and bias summary
  BTC’s Bear Bounce: Sell the Rally Near $66K as Bears Target $59K–$52K Breakdown
  Ethereum Cracks Under $1,700: Sell the Rally Near $1,750 as Bears Eye $1,380–$1,200
  FxWirePro- Major Crypto levels and bias summary


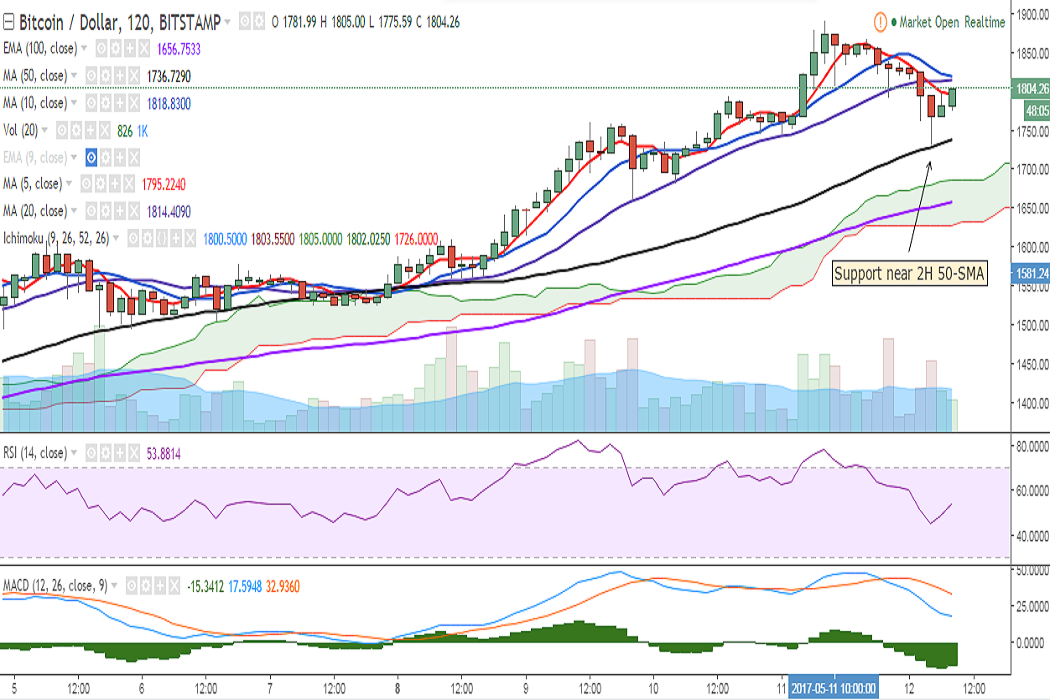
BTC/USD turned red on Friday after it hit a fresh all-time high at 1892 levels on May 11. It dropped to 1733 levels earlier in the day and currently trades at 1788 levels at the time of writing (Bitstamp).
Ichimoku analysis of daily chart:
Tenkan Sen: 1668.47
Kijun Sen: 1526.50
On the upside, the pair faces resistance at 1822 (127.2% extension of 891.33 and 1623.01) and a break above would target 1892 (May 11 high). Further strength would see it testing 1933 (272.2% retracement of 1350 and 891.33).
On the 2-hour chart, the pair has taken support near 1727.95 (2h 50-SMA). A break below could see a dip till 1685 (2h Cloud top)/ 1656 (2h 100-EMA). Further bullishness would be seen if the pair closes above 1814 (2h 20-SMA).
On the 4-hour chart, the pair briefly dropped below 4H 20-SMA, but is currently holding above this level.
Overall trend remains bullish as long as support at 1753 (5-DMA) holds. A close below would see minor bearishness in the pair. Caution is advised as lead indicators are in highly overbought zone.

- News

- Economy

- Central Banks
- Investing
- Research
- Roundups
- Digital Currency
- Insights
- Technical Analysis
- Technology
- Business
- Law
- Health
- Nature
- Fintech
- Science
- Topic
- Opinions
- ©Econometrics LLC . All Rights Reserved.
FxWirePro: BTC/USD takes support near 2H 50-SMA, further bullishness on close above 1814
Friday, May 12, 2017 9:14 AM UTC
Editor's Picks


- Market Data
Most Popular


