


 Major Pair Action Bias: USDCHF Turns Bullish as EURUSD Stays Bearish – Key Pairs to Watch
  ETHUSD Breaks Above $1900 as Bulls Eye $2300 and Beyond
  FxWirePro:USD/JPY hovers near 40-year peak,intervention fears linger
  FxWirePro: EUR/ AUD dips below 1.6300 level, focus on near term support
  NZDJPY Bullish Above 95: Buy Dips Toward 97 as Kiwi Strength Holds Firm
  FxWirePro- Major Pair levels and bias summary
  FxWirePro: AUD/USD bulls struggles as upside momentum fades
  FxWirePro: USD/ZAR slips as rand gains on U.S.-Iran developments
  FxWirePro: GBP/NZD downtrend loses steam, remains on bearish path
  FxWirePro- Major Crypto levels and bias summary


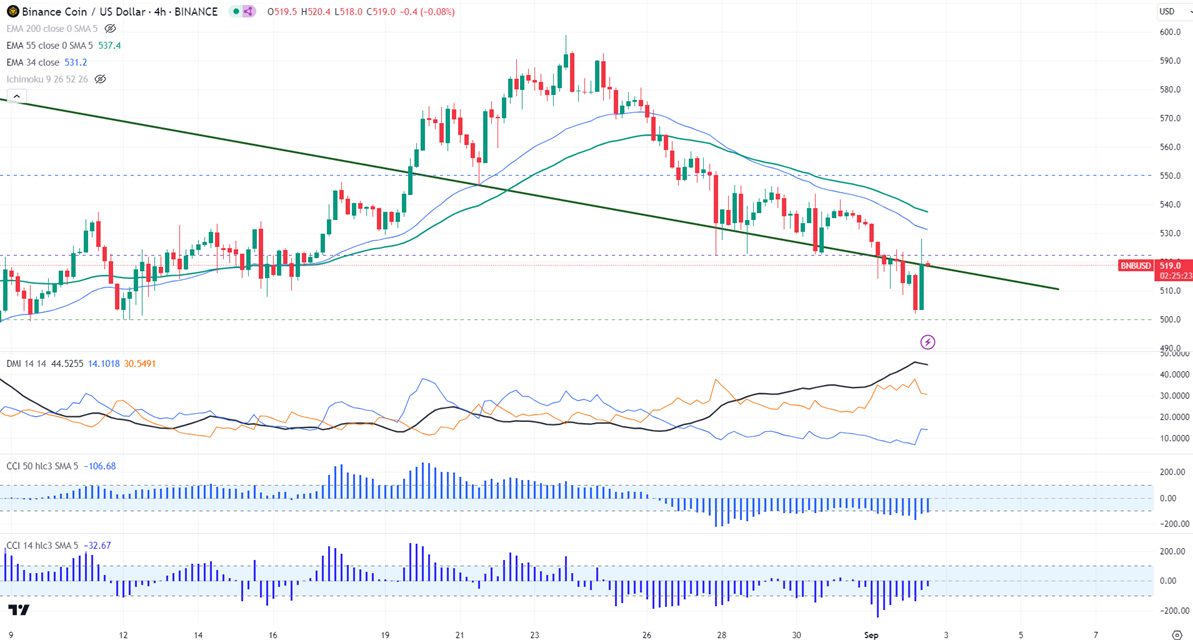
Horizontal trend line- $605
BNBUSD trades weak with intraday bias bearish.
Any daily close above $605 confirms further bullishness.
BNBUSD gained slightly after breaking 200-day EMA. The pair holds below the short-term (34 and 55 EMA) and long-term moving average in the 4-hour. It hit a low of $503 and is currently trading around $519.40.
The bullish invalidation can happen if the pair closes below $403 (Aug 5th low). On the lower side, the near-term support is $519.80 (200-day EMA). Any close below confirms a bearish continuation . A dip to $500/$460/$449 is possible.
The immediate resistance stands at around $553. Any breach above confirms minor bullishness. A jump to $569/$580/$600 is possible. A surge past $605 will take it to $700.
Indicators ( 4- hour chart)
Directional movement index -Bearish
CCI (50)- Bearish
CCI(14)- Bearish
It is good to buy on dips around $500 with SL around $449 for TP of $605.


