


 FxWirePro: EUR/NZD firms after ECB holds rates steady at 2.25%
  FxWirePro- Woodies pivot (Major)
  FxWirePro: GBP/USD slips as middle east tensions and oil surge pressure pound
  NZDJPY Dips Create Fresh Buy Opportunity as Key Support Holds
  BTC, ETH, SOL, XRP, and BNB: Major Crypto Pairs Stay Neutral
  Major Crypto Action Bias: ETHUSD Turns Bullish – Only Bullish Pair to Watch
  FxWirePro- Major Crypto levels and bias summary
  Bitcoin Holds Above $65K as Institutional Inflows Resume; Buy Dips Near $64K
  FxWirePro: USD/ZAR retreats slightly but bias is bullish
  Crypto Bias Report: Trend Signals and Top Bullish Picks
  BTCUSD Holds Above 365 EMA as Bullish Momentum Builds Toward $70K


Horizontal trend line- $605
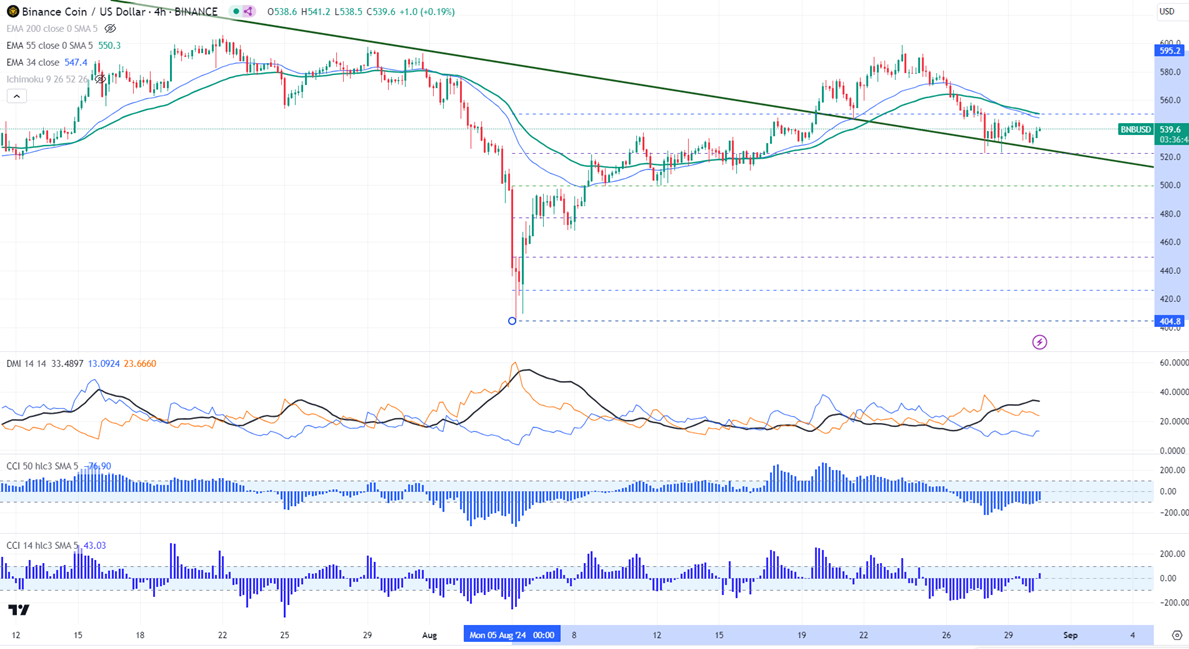
BNBUSD trades flat with an intraday bias bearish.
Any daily close above $605 confirms further bullishness.
BNBUSD has taken support near the 200-day EMA and showed a minor pullback. The pair holds below the short-term (34 and 55 EMA) and long-term moving average in the 4-hour. It hit a high of $575 this week and is currently trading around $540.70.
The bullish invalidation can happen if the pair closes below $403 (Aug 5th low). On the lower side, the near-term support is $519.80 (200-day EMA). Any break below targets $500/$460/$449.
The immediate resistance stands at around $553. Any breach above confirms minor bullishness. A jump to $569/$580/$600 is possible. A surge past $605 will take it to $700.
Indicators ( 4- hour chart)
Directional movement index -Bearish
CCI (50)- Bearish
CCI(14)- Bullish
It is good to buy on dips around $520 with SL around $470 for TP of $605.


