


 GBPJPY Weakens on Soft UK CPI: Sell Below 217.80 Targeting 216.40
  NZDJPY Bullish Above 95: Buy Dips Toward 97 as Kiwi Strength Holds Firm
  FxWirePro: USD/CAD retains bid tone,eyes 1.4200 level
  FxWirePro- Major Crypto levels and bias summary
  Major Pair Action Bias: USDCHF Turns Bullish as EURUSD Stays Bearish – Key Pairs to Watch
  Major Crypto Action Bias: ETHUSD Turns Bullish – Only Bullish Pair to Watch
  FxWirePro- Major Crypto levels and bias summary
  NZDJPY Pulls Back on Kiwi Weakness: Buy Dips at 94.40 Targeting 97
  ETHUSD Breaks Above $1900 as Bulls Eye $2300 and Beyond


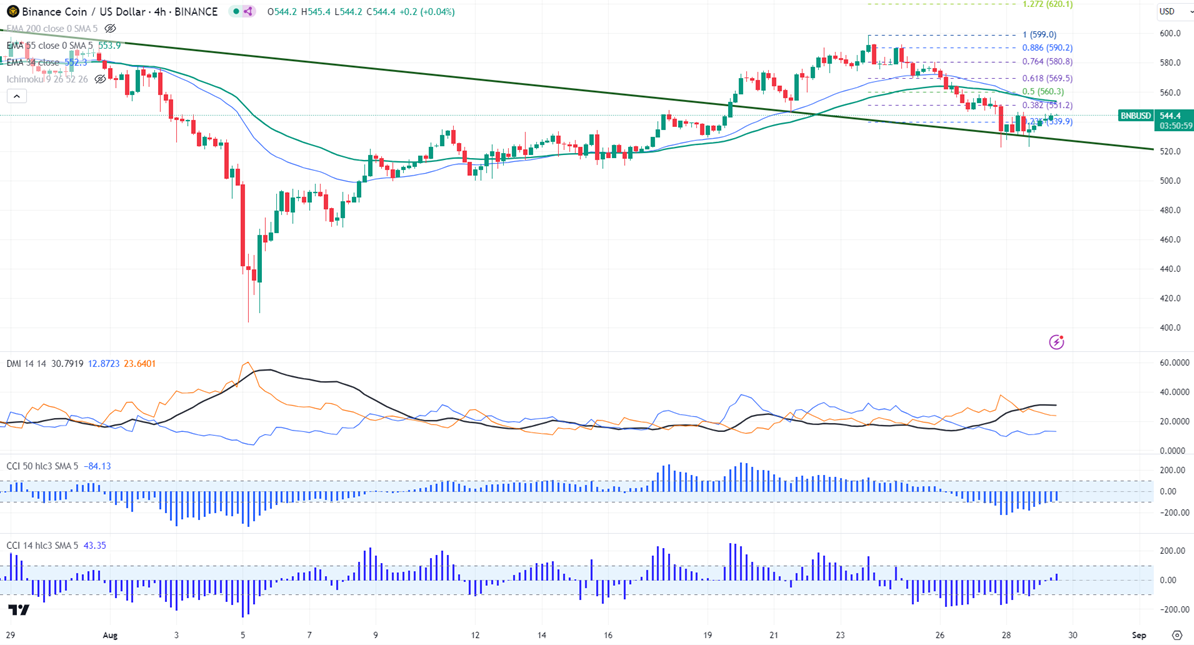
Horizontal trend line- $605
BNBUSD consolidating after a minor sell-off.
Any daily close above $605 confirms further bullishness.
BNBUSD formed a double bottom around $520.The pair holds below the short-term (34 and 55 EMA) and long-term moving average in the 4-hour. It hit a high of $545.80 at the time of writing and is currently trading around $545.
The bullish invalidation can happen if the pair closes below $400. On the lower side, the near-term support is $519.80 (200-day EMA). Any break below targets $500/$460.
The immediate resistance stands at around $553. Any breach above confirms minor bullishness. A jump to $560/$569/$580/$600 is possible. A surge past $605 will take it to $700.
Indicators ( 4- hour chart)
Directional movement index -Bearish
CCI (50)- Bearish
CCI(14)- Bullish
It is good to buy on dips around $520 with SL around $470 for TP of $605.


