


 European Stocks Rally on Chinese Growth and Mining Merger Speculation
  FxWirePro: EUR/AUD bullish outlook with scope to target 1.6550
  FxWirePro: GBP/AUD steadies around 0.9145 ,retains bid tone
  Trump’s "Shock and Awe" Agenda: Executive Orders from Day One
  FxWirePro: USD/CAD hits 14-month high , Scope for further upside
  FxWirePro- Woodies pivot (Major)
  FxWirePro: AUD/USD eases after Australian mixed CPI data
  Mexico's Undervalued Equity Market Offers Long-Term Investment Potential
  Lithium Market Poised for Recovery Amid Supply Cuts and Rising Demand
  U.S. Stocks vs. Bonds: Are Diverging Valuations Signaling a Shift?
  FxWirePro: USD/CNY hits one –month high, scope for further upside
  FxWirePro- Woodies pivot (Major)
  Gold Prices Slide as Rate Cut Prospects Diminish; Copper Gains on China Stimulus Hopes
  AUDJPY Breaks Key Trendline Support — Bears Eye 110 as Momentum Accelerates
  FxWirePro: GBP/NZD gaining momentum for a move towards 2.3350level
  FxWirePro: USD/JPY edges higher as the yen remains vulnerable despite repeated warnings of intervention.
  Gold Prices Fall Amid Rate Jitters; Copper Steady as China Stimulus Eyed


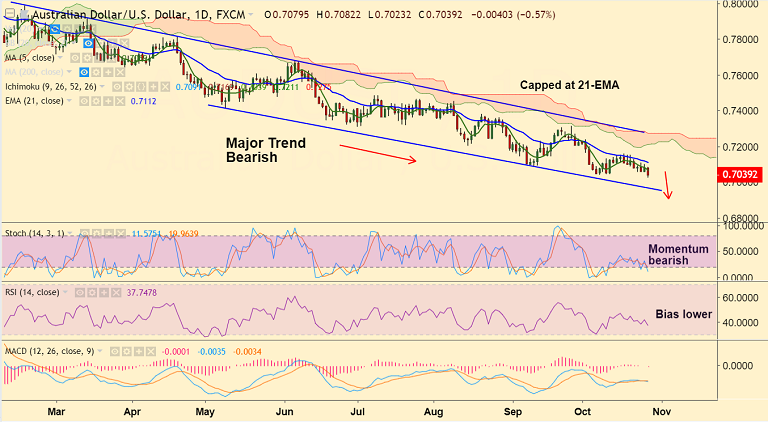
AUD/USD chart on Trading View used for analysis
- AUD/USD trades 0.69% lower on the day at 0.7032 at the time of trading.
- The pair has hit new multi-month lows, levels unseen since Feb 2016.
- Major trend remains bearish. Price action grinds lower in sloping channel pattern.
- Technical studies support further weakness. We see no signs of reversal in the pair.
- Next major support lies at 0.6975 (channel base), breach there will accentuate weakness.
- On the flip side, 21-EMA at 0.7112 is strong resistance. Break above to see further gains.
Support levels - 0.70, 0.6975 (channel base)
Resistance levels - 0.7067 (5-DMA), 0.7112 (21-EMA)
Recommendation: Good to stay short on upticks, SL: 0.7112, TP: 0.70/ 0.6975
For details on FxWirePro's Currency Strength Index, visit http://www.fxwirepro.com/currencyindex.


