


 US Futures Rise as Investors Eye Earnings, Inflation Data, and Wildfire Impacts
  FxWirePro: AUD/USD climbs as US-Iran peace deal sparks risk rally
  FxWirePro- Woodies pivot (Major)
  FxWirePro: GBP/USD range-bound as Iran uncertainty keeps traders cautious
  China's Refining Industry Faces Major Shakeup Amid Challenges
  FxWirePro: USD/ZAR edges higher, set to stay on back foot
  FxWirePro: GBP/AUD runs out of steam but maintains bullish outlook
  Pound-Yen Pullback: GBP/JPY Slips Below Key EMAs as Sterling Weakness Fuels Bearish Bet on 210
  Global Markets React to Strong U.S. Jobs Data and Rising Yields
  U.S. Banks Report Strong Q4 Profits Amid Investment Banking Surge
  Lithium Market Poised for Recovery Amid Supply Cuts and Rising Demand
  Moldova Criticizes Russia Amid Transdniestria Energy Crisis
  FxWirePro: NZD/USD jumps after US and Iran agree preliminary deal
  China’s Growth Faces Structural Challenges Amid Doubts Over Data
  UBS Projects Mixed Market Outlook for 2025 Amid Trump Policy Uncertainty


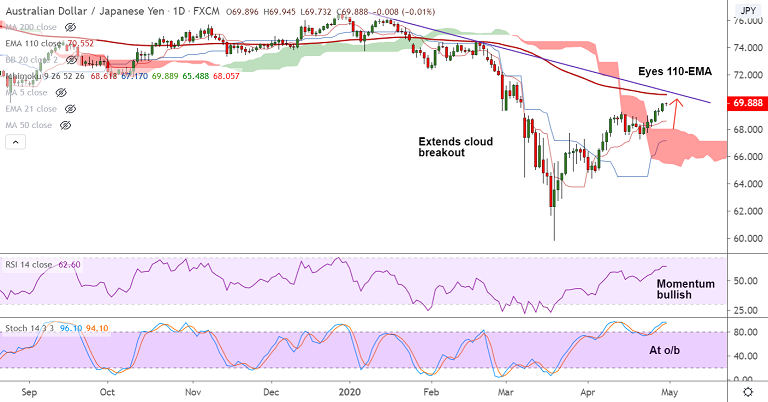
AUD/JPY chart - Trading View
AUD/JPY has resumed upside after a brief pause, scope for further gains, 110-EMA at 70.55 in sight.
Japan’s Retail Trade and Industrial Production data that came in slightly better than the market consensus.
Japan’s industrial production came in at -3.7 pct vs -0.3 pct previous release (expected -5.0). While retail sales stands at -4.6 vs 1.6 previous release (expected -4.6 pct).
Downbeat China data and markets’ risk-off due to US President Donald Trump’s comments on the US-China trade deal exert downside pressure.
But technical indicators hold upside potential. Short-term moving averages have crossed over long-term moving averages in the GMMA indicator.
Momentum is strongly bullish and breakout above daily cloud reinforces bullish bias. Break above 110-EMA could see test of 200-DMA.
Retrace below 55-EMA negates bullish bias. Break below cloud will see downside resumption.


