


 Geopolitical Shocks That Could Reshape Financial Markets in 2025
  Urban studies: Doing research when every city is different
  Global Markets React to Strong U.S. Jobs Data and Rising Yields
  FxWirePro: GBP/AUD steadies around 0.9145 ,retains bid tone
  BTC Slips Below $60K as Institutional Demand Dries Up — Bears Eye $59K Support, Rallies to $63K for Shorts
  Oil Prices Dip Slightly Amid Focus on Russian Sanctions and U.S. Inflation Data
  FxWirePro- Major Pair levels and bias summary
  FxWirePro- Major Pair levels and bias summary
  NZDJPY: The Kiwi Yen's Bull Run Hits a Brick Wall at 92 — Sell the Rally?
  FxWirePro- Major Crypto levels and bias summary
  UBS Projects Mixed Market Outlook for 2025 Amid Trump Policy Uncertainty
  FxWirePro: EUR/AUD bullish outlook with scope to target 1.6500
  Moody's Upgrades Argentina's Credit Rating Amid Economic Reforms
  AUDJPY Breaks Key Trendline Support — Bears Eye 110 as Momentum Accelerates
  Energy Sector Outlook 2025: AI's Role and Market Dynamics
  U.S. Stocks vs. Bonds: Are Diverging Valuations Signaling a Shift?
  UBS Predicts Potential Fed Rate Cut Amid Strong US Economic Data


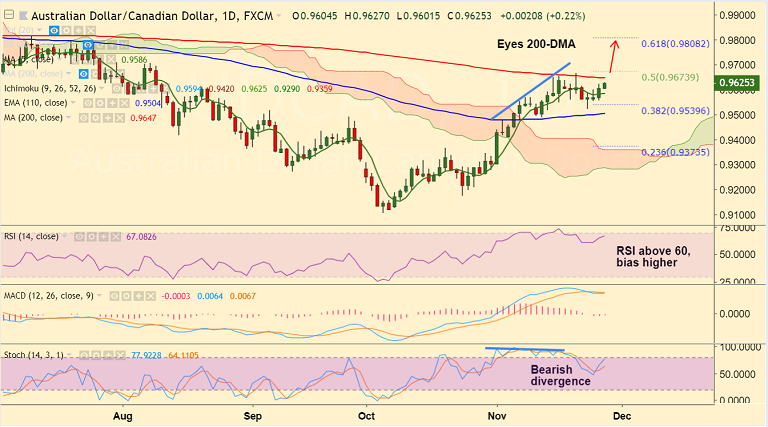
AUD/CAD chart on Trading View used for analysis
- AUD/CAD extends gains, trades 0.24% higher at 0.9627 at the time of writing.
- Price action is extending gains for the 4th straight session, trades shy of 200-DMA at 0.9647.
- Technical indicators support further gains. Stochs and RSI are biased higher, momentum bullish.
- The pair is in a near-term bull trend and breakout at 200-DMA could see further upside.
- That said, we evidence a bearish divergence on Stochs which dents scope for upside.
- We need a breakout at 200-DMA to see further gains. Scope then for test of 61.8% Fib at 0.98.
- On the flipside, rejection at 200-DMA could see test of 110-EMA. Violation there to see bullish invalidation.
Support levels - 0.9587 (5-DMA), 0.9539 (38.2% Fib), 0.9523 (Nov 23 low)
Resistance levels - 0.9647 (200-DMA), 0.9664 (Nov 21 high), 0.97
Recommendation: Watchout for break above 200-DMA to go long.
For details on FxWirePro's Currency Strength Index, visit http://www.fxwirepro.com/currencyindex.


