


 Bank of America Posts Strong Q4 2024 Results, Shares Rise
  FxWirePro- Major Pair levels and bias summary
  Energy Sector Outlook 2025: AI's Role and Market Dynamics
  Moldova Criticizes Russia Amid Transdniestria Energy Crisis
  China's Refining Industry Faces Major Shakeup Amid Challenges
  Bitcoin Sheds $491M in ETF Outflows and Retreats Below $64K; Sellers Reload for $50K
  FxWirePro: EUR/AUD bullish outlook with scope to target 1.6500
  Stock Futures Dip as Investors Await Key Payrolls Data
  Wall Street Analysts Weigh in on Latest NFP Data
  FxWirePro- Major Crypto levels and bias summary
  Goldman Predicts 50% Odds of 10% U.S. Tariff on Copper by Q1 Close
  U.S. Stocks vs. Bonds: Are Diverging Valuations Signaling a Shift?
  Geopolitical Shocks That Could Reshape Financial Markets in 2025
  FxWirePro: GBP/AUD steadies around 0.9145 ,retains bid tone
  S&P 500 Relies on Tech for Growth in Q4 2024, Says Barclays
  US Futures Rise as Investors Eye Earnings, Inflation Data, and Wildfire Impacts


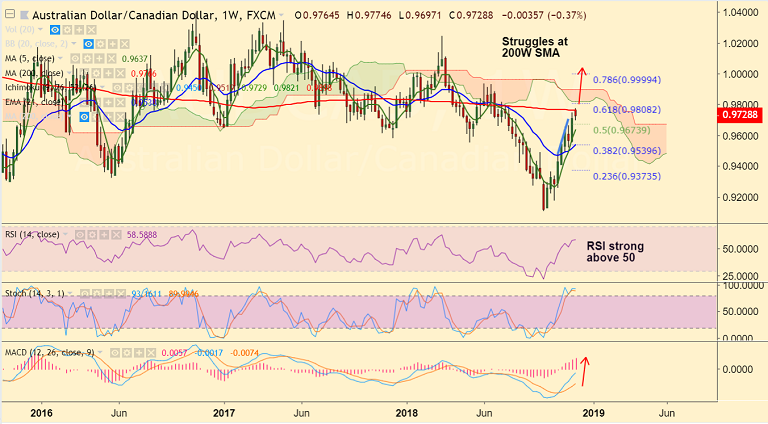
AUD/CAD chart on Trading View used for analysis
- AUD/CAD has failed to break above 200-W SMA which offers stiff resistance at 0.9766.
- The pair trades with strong bullish momentum and breakout at 200-W SMA could propel the pair higher.
- RSI strong on weekly charts, holds above 50 mark and bias higher. MACD is showing a bullish crossover on signal line and bias bullish.
- Breakout at 200W SMA eyes next major resistance at 61.8% Fib at 0.9808 ahead of weekly cloud top at 0.9898.
- On the flipside, rejection at 200-W SMA with break below 200-DMA could see weakness till 0.9523 (Nov 18 low)
Recommendation: Watch out for decisive break above 200W SMA to go long.
For details on FxWirePro's Currency Strength Index, visit http://www.fxwirepro.com/currencyindex.


