


 Oil Prices Dip Slightly Amid Focus on Russian Sanctions and U.S. Inflation Data
  U.S. Banks Report Strong Q4 Profits Amid Investment Banking Surge
  Energy Sector Outlook 2025: AI's Role and Market Dynamics
  With Iran and the US signing a peace deal, where does that leave Benjamin Netanyahu?
  S&P 500 Relies on Tech for Growth in Q4 2024, Says Barclays
  How AI prompting turned writerly description into an everyday skill
  Goldman Sachs: US Dollar Likely to Stay Strong Despite Oil Price Retreat
  Geopolitical Shocks That Could Reshape Financial Markets in 2025
  Urban studies: Doing research when every city is different


The escalating tensions between the US and China, along with the continued resurgence in Covid-19 cases, potentially turning the economic recovery around (as highlighted extensively by Fed speakers ahead of this week’s FOMC meeting), has seen the USD extend its bear-run through supports that have held for the last year, propelling gold to new all-time highs. With US equities, at this stage positive on a month-on-month basis, this is likely to weigh further on the USD with month-end rebalancing.
An earlier study on the interplay between correlations and skews was proposing to sell positive correlations when the relative sign of the two skews involved was opposite. Here
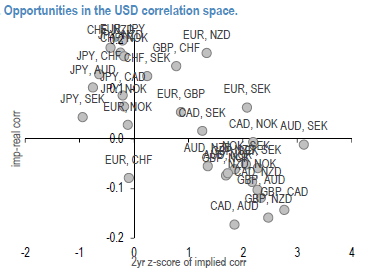
we investigate further the relationship above with the goal of identifying long correlation trades that can receive substantial discounts when positioning for spot moves on the “risk-on” side of the riskies. A proxy of implied realized 3m USD-correlations (refer 1st chart), as obtained via ATM volatilities, does not currently point to any obvious “cheap” correlation opportunity, as cases with historically low implied levels trade at a premium vs. historical ones (and vice-versa).
As the implied correlations above are computed via ATM vols, one could think of investigating strike sensitivity for finding cheaper entry points via lower values. For two pairs with one common USD-leg, we get a proxy of 3 smile pillars (ATM, +-25-delta), then correls are computed via the cross-vols for the corresponding 9 strikes. We’ll present a number of empirical case studies, for guiding us in finding a rule of thumb in this respect. For the EURUSD vs XAUUSD case, the direction EUR-up, Gold-up corresponds to the rich side of skews and also to the highest values of implied correlations. Best correlation discounts could be achieved when playing scenarios like EUR up / XAU down and other way around.
Whether we look at retail investors’ gold allocations or the spec positions on gold futures by hedge funds, we see further room for the gold rally to continue.
For scandies (2nd chart), strike sensitivity would be rather modest when looking at the first diagonal in the 2d plot, where both scandies move in the same direction vs. the USD. Largest correlation discount could be achieved when playing the USDNOK up, USDSEK scenario, which could only be motivated by a rather unlikely idiosyncratic factor, not supported by historical returns. Long Scandi FX on RV; Rotate long NOK vs. GBP, CAD basket into long NOK and SEK vs. CAD.
Trade tips:
Short CADSEK at 6.663. Stop at 6.810 levels.
Short CADNOK at 6.838. Stop at 7.010 levels . Courtesy: JPM


