


 Goldman Sachs Says China Competition Weighs More on EU Growth Than Trade Deficit
  AI can be a personal trainer in your pocket – but is it safe?
  Bank of America Upgrades T-Mobile to Buy, Says LEO Satellite Fears Are Overdone
  USA at 250: the Black American struggle for life, liberty and the pursuit of happiness
  Vietnam’s population hit the 100 million milestone. Where’s it headed?
  Smartphones are helping filmmakers tell the stories the movie industry overlooks
  Goldman Sachs Raises USD/JPY Forecast, Sees Yen Weakness Persist Through 2027
  State of emergency in Crimea as Ukraine focuses pressure on ‘jewel in Putin’s crown’
  Elon Musk is remaking the world, like Henry Ford before him – but more dangerously
  Alcohol is one of the most dangerous drugs, yet its presence is ubiquitous in social settings and celebrations


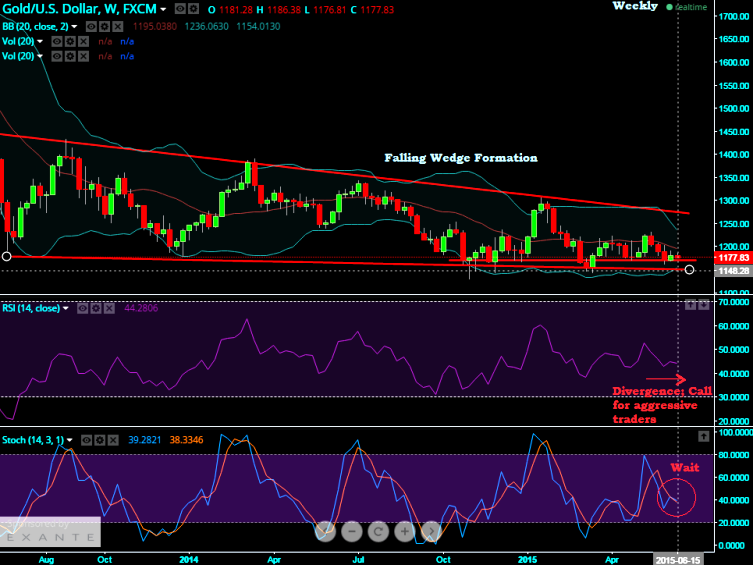
Both on weekly and monthly graphs of this precious metal prices, falling wedge pattern has been spotted out.
Upswings are expected for sure but instant trend reversal still unlikely.
Break below 1175.35 levels can be seen closely when the bulls may gain buying interest at this levels.
The falling wedge is usually a bullish pattern signaling that one is about to witness the price break upwards through the wedge and move into an uptrend.
But at this level our cautious call is to wait patiently for better confirmation that is yet to support and configure from RSI & stochastic indications as well.
Price movements of this commodity has been oscillating between the trend lines as shown in the chart.
The trend lines of this pattern converge with both being slanted in a downward direction as the price is trading in a downtrend.

- News

- Economy

- Central Banks
- Investing
- Research
- Roundups
- Digital Currency
- Insights
- Technical Analysis
- Technology
- Business
- Law
- Health
- Nature
- Fintech
- Science
- Topic
- Opinions
- ©Econometrics LLC . All Rights Reserved.
Expect XAU/USD upswings on Falling Wedge but instant trend reversal unlikely
Monday, June 15, 2015 8:57 AM UTC
Editor's Picks


- Market Data
Most Popular


