


 Ethereum Cracks Under $1,700: Sell the Rally Near $1,750 as Bears Eye $1,380–$1,200
  FxWirePro- Major Crypto levels and bias summary
  FxWirePro- Major Crypto levels and bias summary


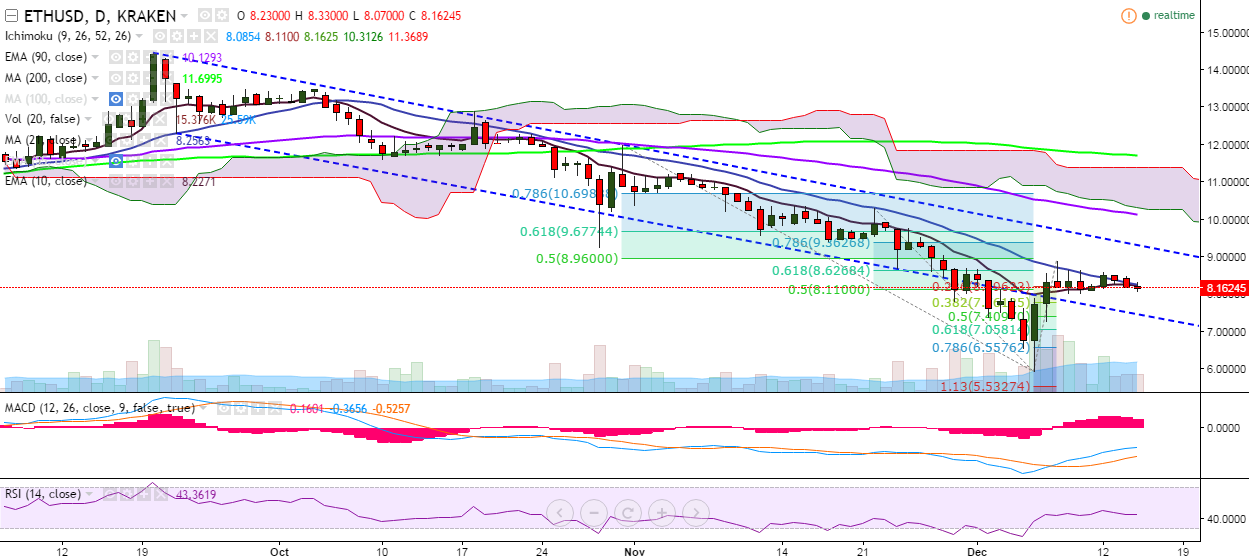
ETH/USD failed to break above 61.8% fib and has slipped below 10-EMA. It is currently trading at 8.16 levels at the time of writing (Kraken).
Ichimoku analysis (Daily chart):
Tenkan-Sen: 7.40
Kijun-Sen: 8.11
Trend reversal: 10.17 (90-EMA)
On the upside, major resistance is seen at 8.62 (61.8% retracement of 10.30 and 5.92) and a consistent break above would see it testing 8.89 (December 08 high)/9.30 levels (trend line joining 14.45 and 12).
On the reverse side, the pair is trading just shy of 10-EMA and a break below 8.00 (December 09 low) would drag it to 7.45 (trend line joining 12.30 and 8.67). Further weakness would see it testing 7 (August 02 low).

- News

- Economy

- Central Banks
- Investing
- Research
- Roundups
- Digital Currency
- Insights
- Technical Analysis
- Technology
- Business
- Law
- Health
- Nature
- Fintech
- Science
- Topic
- Opinions
- ©Econometrics LLC . All Rights Reserved.
ETH/USD breaks below 10-EMA support, dip till 7.45 likely
Thursday, December 15, 2016 7:23 AM UTC
Editor's Picks


- Market Data
Most Popular


