


 NZDJPY Extremely Bullish Above 94: Broad NZD Buying Fuels Fresh Upside – Buy Dips at 93.70 Targeting 95
  US Inflation Expected to Ease in June, but Fed Rate Hike Risks Persist Amid Middle East Tensions
  Major Pair Action Bias: Extremely Bullish Surge Powers GBPUSD & NZDUSD as Bullish Momentum Ignites
  GBPJPY Bullish on Consolidation: Holds Above 216 After 218 Top – Buy Dips at 217 Targeting 220
  FxWirePro: GBP/USD hits one-month high, scope for further upside
  FxWirePro- Major Crypto levels and bias summary
  FxWirePro: GBP/USD advance after softer US inflation dims Fed rate hike bets
  FxWirePro: GBP/NZD downtrend slows, but bearish sentiment remains
  Bank of America Upgrades T-Mobile to Buy, Says LEO Satellite Fears Are Overdone
  FxWirePro- Major Pair levels and bias summary


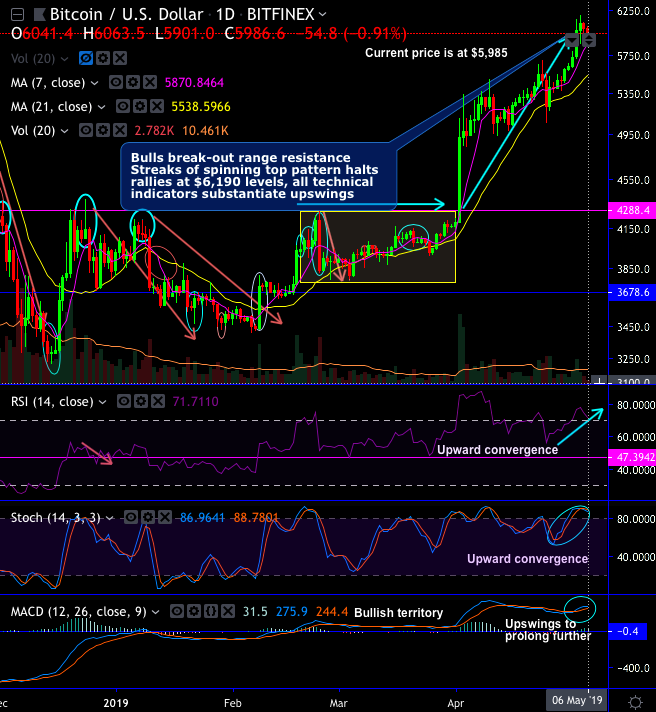
Bitcoin bulls have managed to break-out $5,746 levels which acted as strong support (now stiff resistance, refer weekly chart for intermediate trend).
According to InsideBitcoins, BTCUSD has now approached the critical resistance between $5500 and $6500, considerably high volatility can be expected outside the channel.
The pair break-out range resistance with a stern bullish engulfing candle in the minor trend, ever since then the prices are constantly spiking above DMAs (refer daily plotting).
The rallies are now halted at $6,190 levels (i.e. 6-wk highs) upon spinning top pattern, while all technical indicators still substantiate upswings.
Bullish engulfing patterns have occurred at $4,922.10 on daily, and at $4,071 and $5,238 levels on weekly plotting.
Well, these bullish engulfing patterns are coupled with bullish EMA & MACD crossovers signal upside price traction as the current price breaks-out stiff resistance & spikes well above 21-DMAs and EMAs.
Both momentum oscillators (RSI & Stochastic curves) show upward convergence to the current upswings that indicate the intensified buying momentum (on both timeframes).
Overall, after 2018’s bearish streaks, the pioneer cryptocurrency has begun to consolidate of late. Foreseeing further rallies on cards and major uptrend to resume in the long run, it is wise to capture minor price dips to construct long build ups for the medium term targets up to $6,814 levels with a strict stop loss of $5,395 level (spot reference: $5,985).
Currency Strength Index: FxWirePro's hourly BTC spot index is inching towards 167 levels (which is highly bullish), while hourly USD spot index was at 12 (mildly bullish) while articulating (at 10:23 GMT).


