


 ETH Stands Alone Bullish; BTC, SOL, XRP, BNB Neutral
  FxWirePro: AUD/ USD eases as risk sentiment remains fragile
  FxWirePro- Major Crypto levels and bias summary
  FxWirePro- Major Crypto levels and bias summary
  FxWirePro- Woodies pivot (Major)
  NZDJPY Bullish Surge: Strong Kiwi Ignites Fresh Upside as 94 Support Holds and All EMAs Align
  FxWirePro: GBP/USD under pressure despite UK's modest economic growth
  FxWirePro:EUR/NZD stuck In narrow ranges, focus on near term support
  AUDJPY Bullish Surge: Strong Australian Dollar Fuels Fresh Upside as Pair Holds Above 113.50 and All EMAs Align
  CAD/JPY Surges on Broad-Based Canadian Dollar Buying


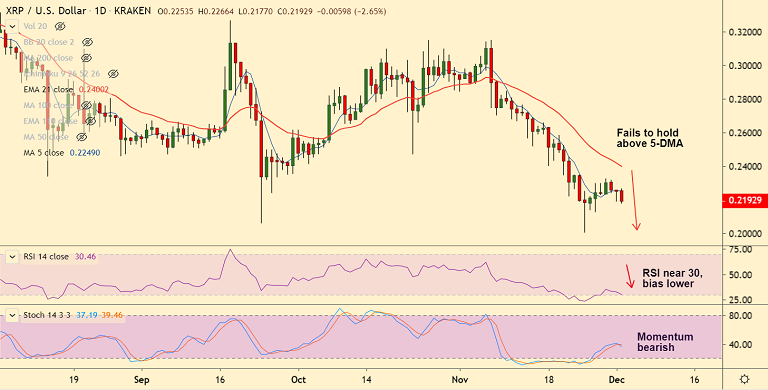
XRP/USD chart - Trading View
Exchange - Kraken
Support: 0.2038 (Lower BB); Resistance: 0.2232 (200H MA)
Technical Analysis: Bias Bearish
XRP/USD starts the week on a bearish note, extends weakness below 5-DMA.
The pair was trading 2.57% lower on the day at 0.2195 at 11:15 GMT, after closing 0.30% lower in the previous session.
Technical indicators have turned bearish, Stochs and RSI have turned bearish.
'Death Cross' (bearish 50-DMA crossover on 200-DMA) on the hourly charts adds to the bearish bias.
Major and minor trend for the pair are bearish as indicated by the GMMA indicator.
Scope for dip till lower BB at 0.2038. Break below 0.20 (psychological mark) could plummet prices to fresh lows.


