


 FxWirePro- Major Crypto levels and bias summary
  FxWirePro: GBP/USD gains some upside momentum but still bearish
  Bitcoin Consolidates Near $78K: Will Strong ETF Inflows Trigger a Breakout to $90K?
  FxWirePro: USD/CNY sees some bounce after yesterday's fall
  FxWirePro- Woodies Pivot (Major)
  FxWirePro- Major Crypto levels and bias summary
  EUR/USD Defies ECB Rate Hike to Reclaim 1.1600: Technical Setup Points to Buy-on-Dips Opportunity
  FxWirePro- Major Pair levels and bias summary
  Upbeat UK GDP Fails to Lift GBP/JPY as Bears Target 207
  FxWirePro- Major Pair levels and bias summary
  FxWirePro: GBP/AUD struggle to extend its recovery, good to sell on rally


 Add as a preferred source on Google
BTG/USD chart - Trading View
Exchange - Bifinex
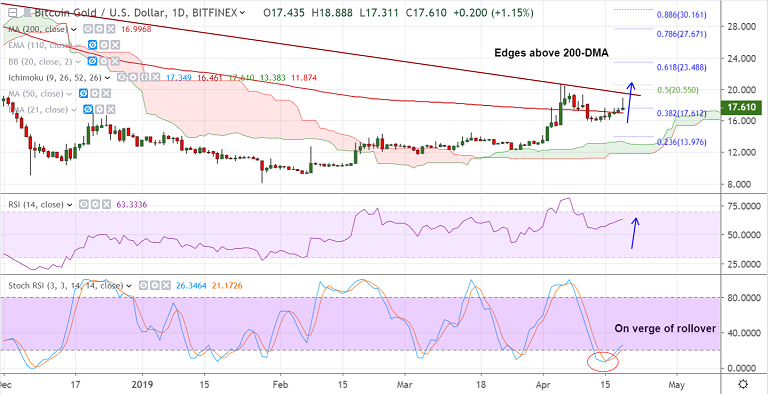
Support: 17.00 (200-DMA); Resistance: 19.50 (Trendline)
Technical Analysis: Bias Bullish
- BTG/USD has retraced from weekly highs at 18.88, bias bullish
- The pair is extending gains above 200-DMA and we see scope for further upside
- Stochastics RSI indicator is on verge of retrace from oversold levels, RSI has turned
- GMMA has shown a shift in trend with shorter term averages edging above the longer term averages
- Technical indicators support further upside in the pair. Scope for test of 19.50 (trendline resistance)
- 200-DMA is immediate support at 17.00, break below 21-EMA to see downside till 110-EMA at 14.91
For details on FxWirePro's Currency Strength Index, visit http://www.fxwirepro.com/currencyindex.

- News

- Economy

- Central Banks
- Investing
- Research
- Roundups
- Digital Currency
- Insights
- Technical Analysis
- Technology
- Business
- Law
- Health
- Nature
- Fintech
- Science
- Topic
- Opinions
- ©Econometrics LLC . All Rights Reserved.
Crypto Technicals: BTG/USD edges lower from weekly highs at 18.88, bias higher
Friday, April 19, 2019 10:10 AM UTC
Editor's Picks



- Market Data
Most Popular




