


 Crypto Major Pair Action Bias: ETHUSD Bullish as BTCUSD, SOLUSD & XRPUSD Stay Neutral
  FxWirePro: USD/CAD falls after BoC rate hold and weak U.S. producer inflation
  FxWirePro- Major Crypto levels and bias summary
  FxWirePro- Major Crypto levels and bias summary
  Major Pair Action Bias: Extremely Bullish Surge Powers GBPUSD & NZDUSD as Bullish Momentum Ignites
  FxWirePro :USD/JPY bulls loosen their grip a bit, dips to be bought
  FxWirePro- Major Crypto levels and bias summary
  JPY Action Bias: Extremely Bullish Surge Ignites Across NZD, GBP & AUD
  FxWirePro- Woodies pivot (Major)
  NZDJPY Extremely Bullish Above 94: Broad NZD Buying Fuels Fresh Upside – Buy Dips at 93.70 Targeting 95


, 'Shooting Star' on weekly charts to plummet prices further - EconoTimes)


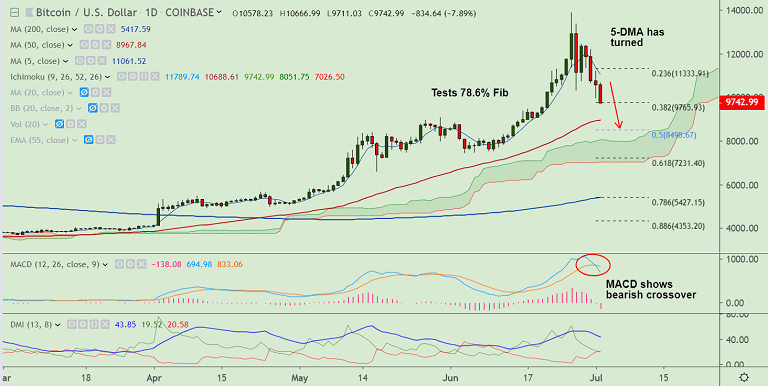
BTC/USD chart - Trading View
Exchange - Coinbase
Support: 8872 (55-EMA); Resistance: 10298 (21-EMA)
Technical Analysis: Bias Bearish
BTC/USD extends weakness below $10,000 mark, hits new 2-week lows at 9733.
Technical indicators support weakness. Stochs and RSI are sharply lower.
MACD is now showing a bearish crossover on signal line. GMMA indicators shows shift in trend towards downside on the intraday charts.
'Bearish divergence' on the daily charts and a confirmed 'Death Cross' on the hourlies adds to the bearish bias.
Further, 'Shooting Star' pattern form on the previous week's candle is likely to drag prices lower.
The pair has broken below 38.2% Fib and is on track to test 55-EMA at 8872.
For details on FxWirePro's Currency Strength Index, visit http://www.fxwirepro.com/currencyindex.


