


 Elon Musk is remaking the world, like Henry Ford before him – but more dangerously
  USA at 250: the Black American struggle for life, liberty and the pursuit of happiness
  Citi Raises TSMC Price Target as AI Chip Demand Strengthens Growth Outlook
  Goldman Sachs Raises USD/JPY Forecast, Sees Yen Weakness Persist Through 2027
  Alcohol is one of the most dangerous drugs, yet its presence is ubiquitous in social settings and celebrations
  Bernstein Names IAG, Ryanair as Top European Airline Stocks Ahead of Earnings
  Vietnam’s population hit the 100 million milestone. Where’s it headed?
  Buy the Dip: Gold Holds Strong at $3980, Targets $4150
  Goldman Sachs Says China Competition Weighs More on EU Growth Than Trade Deficit
  State of emergency in Crimea as Ukraine focuses pressure on ‘jewel in Putin’s crown’


 - EconoTimes)


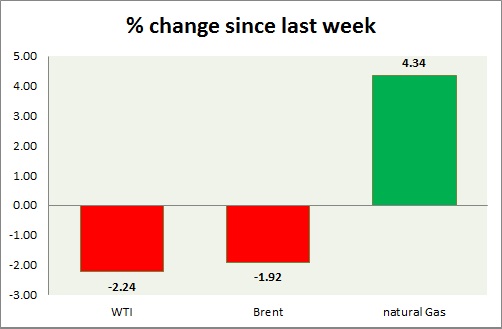
Energy pack is mixed, while oil is up, gas is in red. Weekly performance at a glance in chart & table.
Oil (WTI) -
- WTI trades in low volatility today, outlook remains bearish. WTI traded as low as $51.4/barrel falling to clear above 52 area as Iran deal continues to weigh.
- $54 area remains crucial resistance. Today's range $52.2-51.6
- WTI is likely to fall towards $42 area, once $50 support gets broken.
- WTI is currently trading at $51.6/barrel. Immediate support lies at $51.2-50 and resistance at $54
Oil (Brent) -
- Brent is treading water, facing headwinds from possibilities of sanctions removal.
- Brent-WTI spread gained 60 cents today, currently trading at $6/barrel.
- Target has reached around $55/barrel, and next target is around $51/barrel.
- Brent is trading at $57.6/barrel. Immediate support lies at $55 area and resistance at $59/60 region.
Natural Gas -
- Natural gas bulls remain in control but facing tough resistance around $2.95/mmbtu area.
- A break above $2.95 area would push prices to first target of $3.1/mmbtu.
- Bullish Doji, in weekly chart remains in focus.
- Natural Gas is currently trading at $2.91/mmbtu. Immediate support lies at $2.55, $2.45 area & resistance at $2.95, $3.04, $3.32.
|
WTI |
-2.24% |
|
Brent |
-1.92% |
|
Natural Gas |
+4.34% |


