


 FxWirePro- Major Crypto levels and bias summary
  Ethereum Cracks Under $1,700: Sell the Rally Near $1,750 as Bears Eye $1,380–$1,200
  FxWirePro- Major Crypto levels and bias summary
  FxWirePro- Major Crypto levels and bias summary


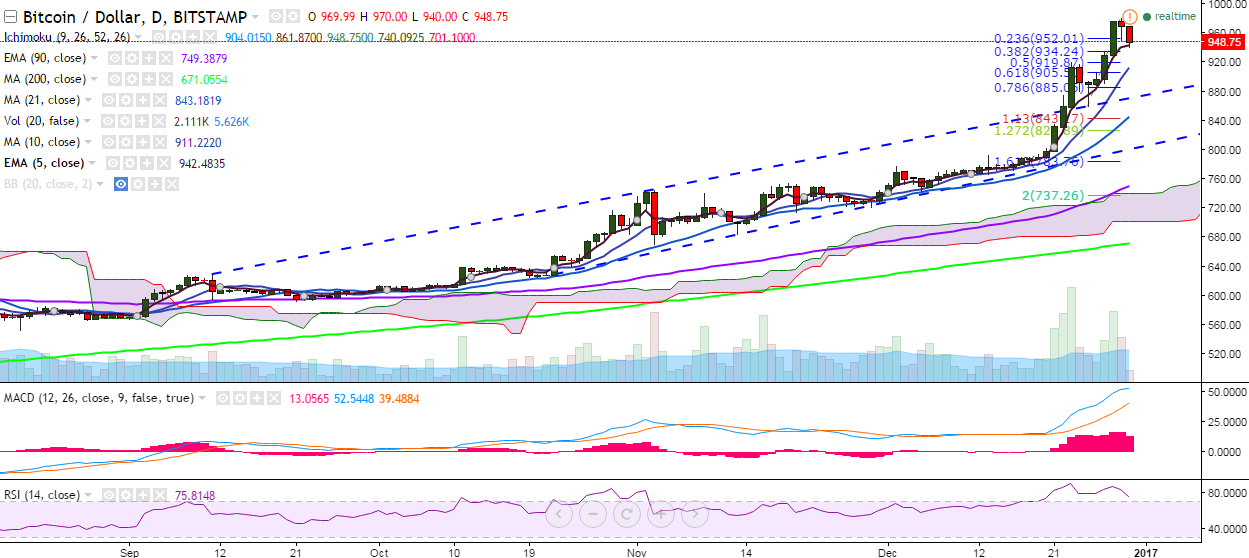
BTC/USD failed to break above 981 levels and turned red on Thursday. It plunged further down on Friday and fell to 940 levels. It is currently trading at 948 levels at press time (Bitstamp).
Long-term trend: Bullish
Short-term trend: Bullish
Ichimoku analysis of daily chart:
Tenkan Sen: 888.78
Kijun Sen: 861.87
Trend reversal: 744.90 (90 EMA)
On the upside, strong resistance is seen at 981 levels (200% retracement of 920 and 859) and a break above would target 1005 (161.8% retracement of 980.74 and 940)/1055.98 (161.8% extension of 859 and 980.74).
On the reverse side, the pair is likely to take support at 939.35 (5-EMA) and a break below would see it testing 905 (61.8% retracement of 859 and 980)/ 896.20 (10-day MA).

- News

- Economy

- Central Banks
- Investing
- Research
- Roundups
- Digital Currency
- Insights
- Technical Analysis
- Technology
- Business
- Law
- Health
- Nature
- Fintech
- Science
- Topic
- Opinions
- ©Econometrics LLC . All Rights Reserved.
BTC/USD takes support near 5-EMA, further bullishness only above 981
Friday, December 30, 2016 7:21 AM UTC
Editor's Picks


- Market Data
Most Popular


