


 FxWirePro: USD/CNY edges lower , bearish outlook persists
  NZDJPY Smashes 4-Month High on Kiwi Buying Frenzy – Bullish Setup Remains Strong
  FxWirePro: GBP/AUD caught in narrow range, bias neutral
  AUDJPY Range Traps Bulls: Sell Rallies at 112.60, Target 110
  FxWirePro: AUD/USD slips on risk aversion as Middle East tensions escalate
  FxWirePro:EUR/NZD extends decline, key support lies ahead
  FxWirePro: USD/ CNY gains some ground but bearish outlook persists
  FxWirePro: AUD/USD firms slightly, but downward resumption looks likely
  FxWirePro: GBP/USD weighed down by renewed Middle East attacks
  FxWirePro- Major Crypto levels and bias summary
  FxWirePro: NZD/USD advances as hawkish outlook by a top policy maker boosts kiwi dollar
  BTCUSD Bullish Breakout: Clears 800-EMA After Consolidation, Buy Dips Toward $74,900
  FxWirePro- Major Crypto levels and bias summary
  FxWirePro: EUR/AUD edges higher but outlook still bearish


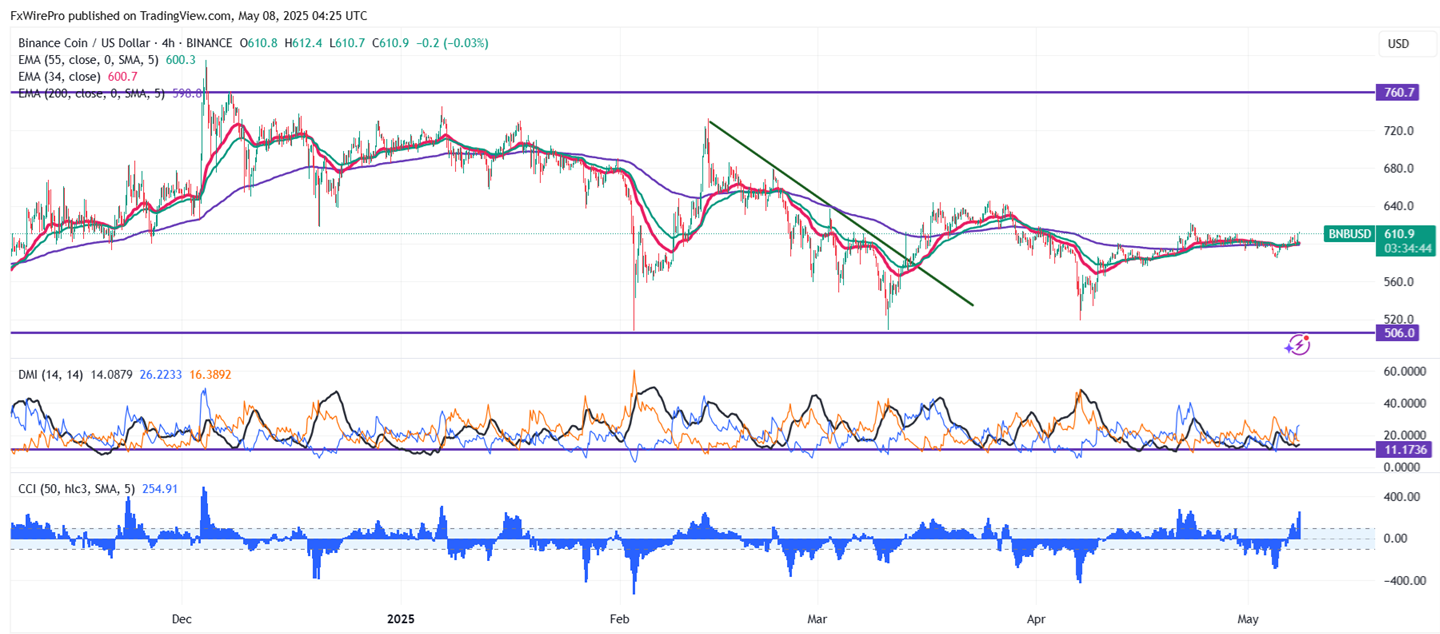
BNB/USD gained slightly after forming a minor bottom around $584.40. It hit a high of $612.40 at the time of writing and is currently trading around $610.80.
Overall bias remains bullish as long as support of $500 holds. It trades above the 34 and 55 EMA on the 4-hour chart. Near-term support is around $560, any breach below targets $50. If the pair closes below $500, potentially leading to further declines towards $400.
Immediate Resistance is at $622. A successful breakout above this resistance could suggest bullish momentum, with further gains possible towards $645/ $678/$700/$730.
Indicators (4-Hour Chart)
- Directional Movement Index: Bullish
- CCI (50): Bullish
Trading Strategy
It is good to buy on dips around $600 with a stop-loss set at $540 and a target price of $730/$1000.


