


 Goldman Sachs Says China Competition Weighs More on EU Growth Than Trade Deficit
  Bank of America Upgrades T-Mobile to Buy, Says LEO Satellite Fears Are Overdone
  Goldman Sachs Raises USD/JPY Forecast, Sees Yen Weakness Persist Through 2027
  Morgan Stanley Says China’s Reusable Rocket Progress Poses Long-Term Challenge to SpaceX
  US Inflation Expected to Ease in June, but Fed Rate Hike Risks Persist Amid Middle East Tensions
  Gold Surges Past $4150 on Dovish Fed Signals and Weak Jobs Data; Bullish Outlook Prevails
  Bernstein Names IAG, Ryanair as Top European Airline Stocks Ahead of Earnings
  JPMorgan Cuts Gold Price Forecast, Sees Bullion Reaching $4,500 by End of 2026


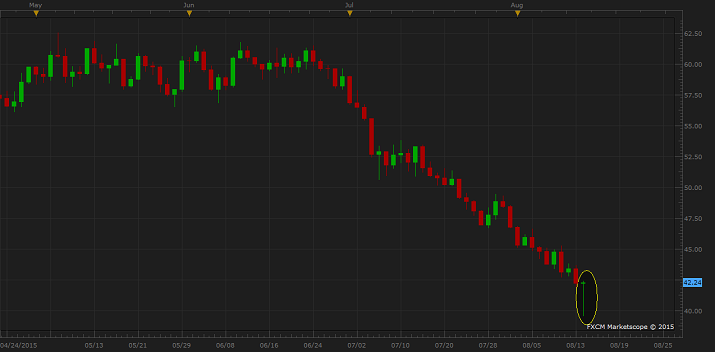
Today's sharp fall and equally sharp bounce back created is on the process of creating a unique candle in WTI daily chart, which makes today's final closing extremely pivotal in judging further moves ahead.
WTI is in the process of creating in very long legged Doji (Dragonfly) or long legged hammer in daily chart, both of which if appears after sharp downfall is considered as very strong bullish reversal signal.
The pattern will form if WTI is able to close today around $42.1-$42.2, which will form the doji or closing at high, which would form a hammer.
Though it definitely pays off to trade with the fundamental, which is supply glut as of now but these short term signals, derived from Japanese candle sticks should not be ignored.
Trading idea -
- WTI has reached all our targets ($55, 51, 46, 42), since short call was provided around $60 area. So with no positions we are ready to recommend short term buy if the above candles take form.
- To confirm the pattern a PDH (previous day high) break is required. However we stand ready to be little aggressive and stands ready to buy with $39.5/barrel as stop at lower price if the above mentioned candles are formed.


