


Candlestick Pattern- Shooting Star (4 hours chart)
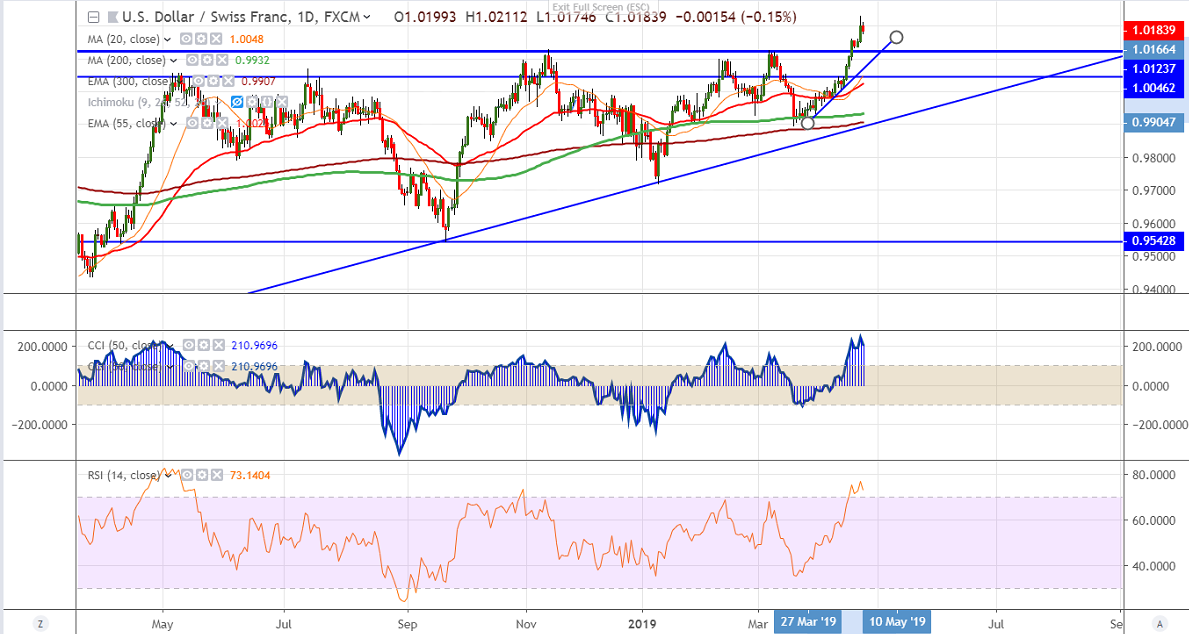
USDCHF trades lower after a massive jump of more than 200 pips in past 10 days on account of broad based US dollar buying and easing trade tension has decreased demand of safe haven assets. The pair hits high of 1.02305 and is currently trading around 1.01791.
The near term support is around 1.01660 (20- 4H MA) and any break below will take the pair to next level till 1.0125/1.0100.
The major resistance is around 1.02500 and any convincing break above targets 1.0300/1.03400.
The momentum indicator RSI in daily chart is around 75 indicates overbought and so minor decline cannot be ruled out.
It is good to sell on rallies around 1.0200 with SL around 1.02350 for the TP of 1.0125.


