


 Gold Prices Fall Amid Rate Jitters; Copper Steady as China Stimulus Eyed


If you ask any financial market respondent, why oil price dropped more than 60% since 2014?
The answer in everyone’s lips will be “Supply Glut”, before the get into further details and their perception of the problem. Some may blame shale oil, while others may accuse OPEC. But main reason likely to remain same, oversupply in short span of time, which couldn’t be absorbed by demand across globe, since growth turned out much weaker than forecast.
So, it makes complete sense, to keep a tab on supply and demand in the market, since it has been the major driving force.
While supply glut has been so true, recent drop of U.S. oil production below 9 million barrels/day and Crude oil rallying about 20% YTD are also very true.
Real question is, whether the rally is sustainable or not.
Fundamentally speaking, the rally may not sustain very long. But even saying that we expect speculative forces are likely to push prices higher in the near term, especially with Dollar being on the weaker side. But current rally pushing prices beyond $60/barrel area seems unlikely. WTI is currently trading at $45/barrel and Brent at $1.8/barrel premioum.
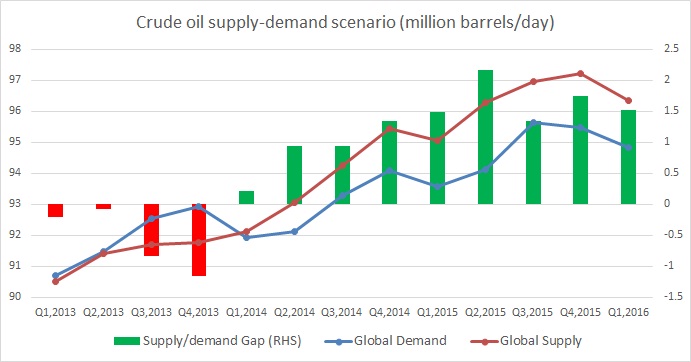
Simply because, according to latest figure from International Energy Agency (IEA), global oil supply is still 1.5 million barrels in excess of demand and add large chunk of inventories to that, you have little improvement in supply side, which strongly contradicts price rise.
For details on Supply and demand since 2013, check the table below and chart attached.
|
All in million barrels/day |
|||
|
|
Global Demand |
Global Supply |
Supply/demand Gap (RHS) |
|
Q1,2013 |
90.71 |
90.5 |
-0.21 |
|
Q2,2013 |
91.47 |
91.4 |
-0.07 |
|
Q3,2013 |
92.54 |
91.71 |
-0.83 |
|
Q4,2013 |
92.93 |
91.77 |
-1.16 |
|
Q1,2014 |
91.93 |
92.14 |
0.21 |
|
Q2,2014 |
92.12 |
93.07 |
0.95 |
|
Q3,2014 |
93.3 |
94.25 |
0.95 |
|
Q4,2014 |
94.1 |
95.45 |
1.35 |
|
Q1,2015 |
93.58 |
95.07 |
1.49 |
|
Q2,2015 |
94.12 |
96.29 |
2.17 |
|
Q3,2015 |
95.63 |
96.98 |
1.35 |
|
Q4,2015 |
95.48 |
97.23 |
1.75 |
|
Q1,2016 |
94.82 |
96.35 |
1.53 |


